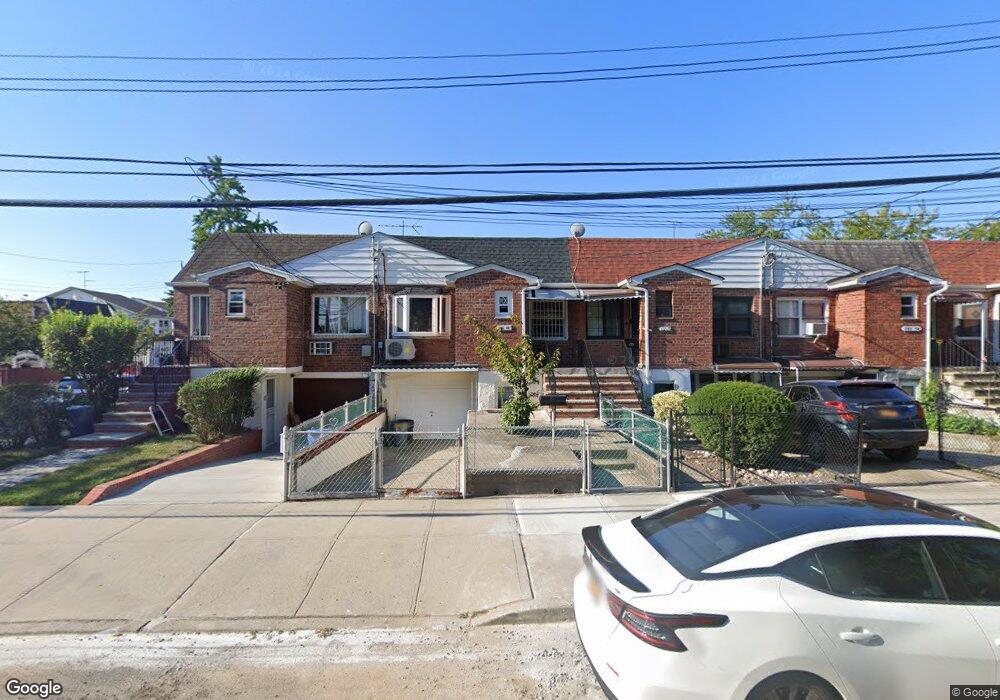
15118 Peck Ave Flushing, NY 11355
Flushing NeighborhoodEstimated Value: $877,000 - $1,147,000
--
Bed
--
Bath
1,429
Sq Ft
$722/Sq Ft
Est. Value
About This Home
This home is located at 15118 Peck Ave, Flushing, NY 11355 and is currently estimated at $1,032,102, approximately $722 per square foot. 15118 Peck Ave is a home located in Queens County with nearby schools including P.S. 024 Andrew Jackson School, Rachel Carson I.S. 237Q, and John Bowne High School.
Ownership History
Date
Name
Owned For
Owner Type
Purchase Details
Closed on
Oct 30, 2020
Sold by
Fang Feng Xiao and He Hui Qin
Bought by
He Edwin
Current Estimated Value
Purchase Details
Closed on
Aug 14, 2009
Sold by
Tang Chi Ping
Bought by
Fang Feng Xiao and He Hui Qin
Purchase Details
Closed on
Jun 27, 2006
Sold by
Tan Peter Deyu
Bought by
Tang Chi Ping
Home Financials for this Owner
Home Financials are based on the most recent Mortgage that was taken out on this home.
Original Mortgage
$360,000
Interest Rate
6.71%
Mortgage Type
Purchase Money Mortgage
Purchase Details
Closed on
Nov 4, 2005
Sold by
Ho Chui Ngor and Ho Ho-Fung
Bought by
Tan Peter Deyu
Home Financials for this Owner
Home Financials are based on the most recent Mortgage that was taken out on this home.
Original Mortgage
$102,500
Interest Rate
6.07%
Purchase Details
Closed on
Jul 18, 2000
Sold by
Hsin Cindy
Bought by
Ho Chui Ngor and Lau Crystal
Create a Home Valuation Report for This Property
The Home Valuation Report is an in-depth analysis detailing your home's value as well as a comparison with similar homes in the area
Home Values in the Area
Average Home Value in this Area
Purchase History
| Date | Buyer | Sale Price | Title Company |
|---|---|---|---|
| He Edwin | -- | -- | |
| He Edwin | -- | -- | |
| Fang Feng Xiao | $499,990 | -- | |
| Fang Feng Xiao | $499,990 | -- | |
| Tang Chi Ping | $506,000 | -- | |
| Tang Chi Ping | $506,000 | -- | |
| Tan Peter Deyu | $513,500 | -- | |
| Tan Peter Deyu | $513,500 | -- | |
| Ho Chui Ngor | $248,000 | Fidelity National Title Ins | |
| Ho Chui Ngor | $248,000 | Fidelity National Title Ins |
Source: Public Records
Mortgage History
| Date | Status | Borrower | Loan Amount |
|---|---|---|---|
| Previous Owner | Tang Chi Ping | $360,000 | |
| Previous Owner | Tan Peter Deyu | $102,500 | |
| Previous Owner | Tan Peter Deyu | $359,650 |
Source: Public Records
Tax History Compared to Growth
Tax History
| Year | Tax Paid | Tax Assessment Tax Assessment Total Assessment is a certain percentage of the fair market value that is determined by local assessors to be the total taxable value of land and additions on the property. | Land | Improvement |
|---|---|---|---|---|
| 2025 | $6,597 | $34,814 | $5,617 | $29,197 |
| 2024 | $6,597 | $32,844 | $5,626 | $27,218 |
| 2023 | $6,597 | $32,844 | $5,649 | $27,195 |
| 2022 | $6,141 | $56,580 | $10,020 | $46,560 |
| 2021 | $6,472 | $55,320 | $10,020 | $45,300 |
| 2020 | $5,845 | $54,240 | $10,020 | $44,220 |
| 2019 | $5,433 | $49,920 | $10,020 | $39,900 |
| 2018 | $5,282 | $27,370 | $5,636 | $21,734 |
| 2017 | $5,238 | $27,163 | $6,155 | $21,008 |
| 2016 | $4,813 | $27,163 | $6,155 | $21,008 |
| 2015 | $2,871 | $24,177 | $6,845 | $17,332 |
| 2014 | $2,871 | $22,809 | $7,240 | $15,569 |
Source: Public Records
Map
Nearby Homes
- 54-13 152nd St
- 152-10 Peck Ave
- 54-36 152nd St
- 54-25 152nd St
- 5423 153rd St
- 54-29 153rd St
- 50-16 Kissena Blvd
- 140-24 Quince Ave
- 140-03 Poplar Ave
- 14014 Poplar Ave
- 140-19 Rose Ave
- 150-30 Booth Memorial Ave
- 57-12 153rd St
- 14014 Negundo Ave
- 15062 Booth Memorial Ave
- 140-50 Quince Ave
- 52-05 Robinson St
- 58-13 150th St
- 52-06 Bowne St
- 58-33 150th St
- 15116 Peck Ave
- 15120 Peck Ave
- 15114 Peck Ave
- 15112 Peck Ave
- 5412 152nd St
- 152-02 Peck Ave
- 152-04 Peck Ave
- 5414 152nd St
- 5414 152nd St
- 152-12 Peck Ave
- 15108 Peck Ave
- 54-16 152nd St Unit 2Fl
- 5416 152nd St
- 15202 Peck Ave
- 15106 Peck Ave
- 15204 Peck Ave
- 5418 152nd St
- 151-06 Peck Ave
- 5411 151st St
- 15104 Peck Ave