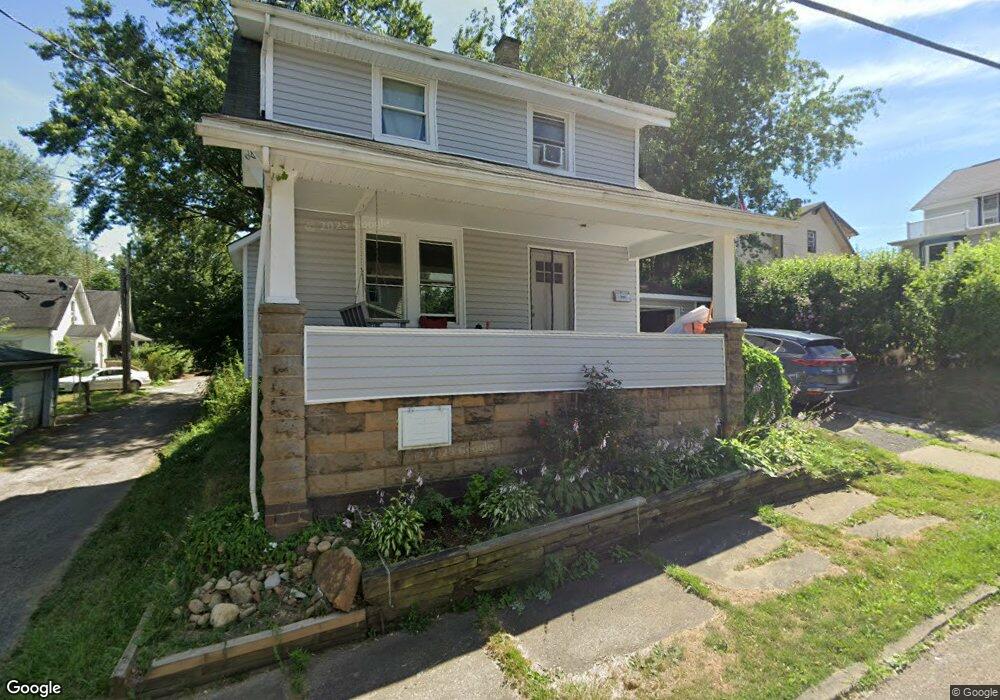
1512 16th St NE Canton, OH 44705
Gibbs Area NeighborhoodEstimated Value: $65,158 - $96,000
2
Beds
1
Bath
1,022
Sq Ft
$76/Sq Ft
Est. Value
About This Home
This home is located at 1512 16th St NE, Canton, OH 44705 and is currently estimated at $77,540, approximately $75 per square foot. 1512 16th St NE is a home located in Stark County with nearby schools including Early Learning Center @ Schreiber, Gibbs Elementary School, and Youtz Intermediate School.
Ownership History
Date
Name
Owned For
Owner Type
Purchase Details
Closed on
May 10, 2022
Sold by
Miller D
Bought by
Herman Kristi J
Current Estimated Value
Purchase Details
Closed on
Sep 13, 2000
Sold by
Hud
Bought by
Miller Ron
Purchase Details
Closed on
Jun 19, 2000
Sold by
Tammy Allison
Bought by
Hud
Purchase Details
Closed on
Nov 27, 1996
Sold by
Property Investments Gro
Bought by
Allison Tammy
Home Financials for this Owner
Home Financials are based on the most recent Mortgage that was taken out on this home.
Original Mortgage
$36,150
Interest Rate
7.94%
Mortgage Type
FHA
Purchase Details
Closed on
Sep 10, 1996
Sold by
United Companies Lending
Bought by
Property Investment Group Ltd
Purchase Details
Closed on
Mar 26, 1996
Sold by
Shrf Nadine Yoho Pr
Bought by
United Companies Lending Corp
Purchase Details
Closed on
Nov 2, 1992
Purchase Details
Closed on
Jun 30, 1992
Purchase Details
Closed on
Apr 30, 1992
Create a Home Valuation Report for This Property
The Home Valuation Report is an in-depth analysis detailing your home's value as well as a comparison with similar homes in the area
Home Values in the Area
Average Home Value in this Area
Purchase History
| Date | Buyer | Sale Price | Title Company |
|---|---|---|---|
| Herman Kristi J | $50,000 | None Listed On Document | |
| Miller Ron | $16,100 | Gateway Title Agency Inc | |
| Hud | $30,000 | -- | |
| Allison Tammy | $35,000 | -- | |
| Property Investment Group Ltd | $16,000 | -- | |
| United Companies Lending Corp | $24,000 | -- | |
| -- | $28,900 | -- | |
| -- | $10,000 | -- | |
| -- | -- | -- |
Source: Public Records
Mortgage History
| Date | Status | Borrower | Loan Amount |
|---|---|---|---|
| Previous Owner | Allison Tammy | $36,150 |
Source: Public Records
Tax History Compared to Growth
Tax History
| Year | Tax Paid | Tax Assessment Tax Assessment Total Assessment is a certain percentage of the fair market value that is determined by local assessors to be the total taxable value of land and additions on the property. | Land | Improvement |
|---|---|---|---|---|
| 2025 | $458 | $19,080 | $1,440 | $17,640 |
| 2024 | -- | $19,080 | $1,440 | $17,640 |
| 2023 | $552 | $9,030 | $1,260 | $7,770 |
| 2022 | $540 | $9,030 | $1,260 | $7,770 |
| 2021 | $546 | $9,030 | $1,260 | $7,770 |
| 2020 | $478 | $7,070 | $1,050 | $6,020 |
| 2019 | $419 | $7,080 | $1,050 | $6,030 |
| 2018 | $422 | $7,080 | $1,050 | $6,030 |
| 2017 | $465 | $7,110 | $1,470 | $5,640 |
| 2016 | $467 | $7,110 | $1,470 | $5,640 |
| 2015 | $470 | $7,110 | $1,470 | $5,640 |
| 2014 | $507 | $7,210 | $1,470 | $5,740 |
| 2013 | $246 | $7,210 | $1,470 | $5,740 |
Source: Public Records
Map
Nearby Homes
- 1517 16th St NE
- 1630 Bonnot Place NE
- 1643 Olive Place NE
- 1602 18th St NE
- 1611 Rowland Ave NE
- 1515 Parkhill Place NE
- 1447 Shriver Ave NE
- 1734 Rowland Ave NE
- 1607 18th St NE
- 1219 17th St NE
- 1210 17th St NE
- 1525 14th St NE
- 1815 Virginia Place NE
- 1126 18th St NE
- 1521 Gibbs Ave NE
- 1007 16th St NE
- 1325 Maddrell Ct NE
- 1540 Miami Ct NE
- 1206 Rucker Place NE
- 1332 Struble Ave NE
- 1516 16th St NE
- 1548 Saint Elmo Ave NE
- 1537 Harmony Ct NE
- 1540 Saint Elmo Ave NE
- 1520 16th St NE
- 1513 16th St NE
- 1509 16th St NE
- 1614 Saint Elmo Ave NE
- 1536 Harmony Ct NE
- 1534 Saint Elmo Ave NE
- 1528 Saint Elmo Ave NE
- 1618 Saint Elmo Ave NE
- 1521 16th St NE
- 1530 Harmony Ct NE
- 1528 16th St NE
- 1622 Saint Elmo Ave NE
- 1525 16th St NE
- 1529 16th St NE
- 1524 Saint Elmo Ave NE
- 1628 Saint Elmo Ave NE