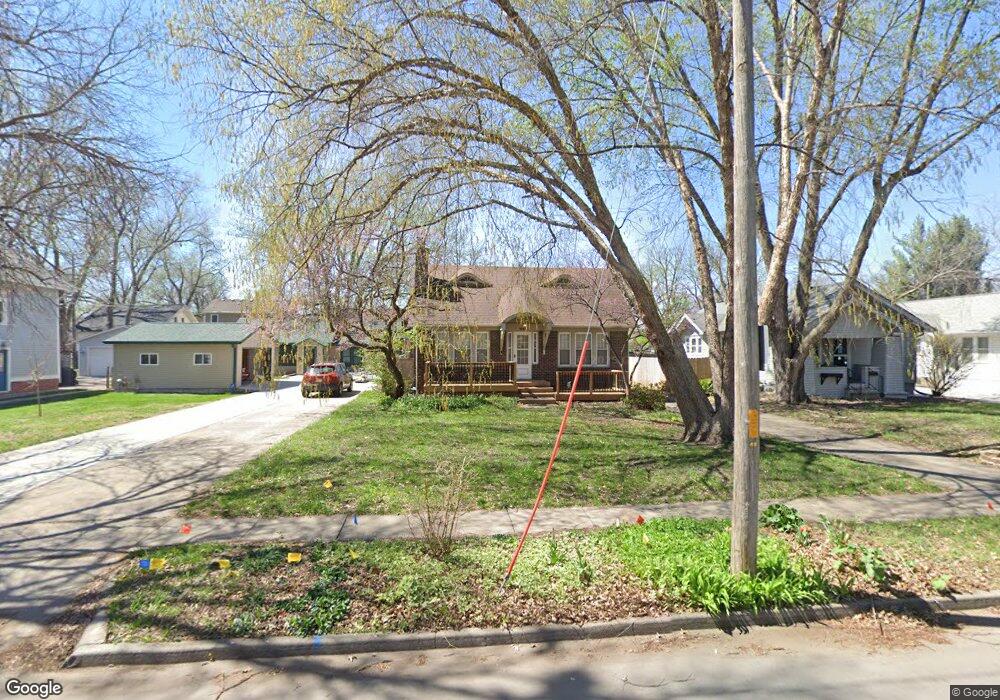
1512 45th St Des Moines, IA 50311
Waveland Park NeighborhoodEstimated Value: $263,341 - $294,000
2
Beds
1
Bath
1,443
Sq Ft
$194/Sq Ft
Est. Value
About This Home
This home is located at 1512 45th St, Des Moines, IA 50311 and is currently estimated at $280,585, approximately $194 per square foot. 1512 45th St is a home located in Polk County with nearby schools including Perkins Elementary School, Merrill Middle School, and Roosevelt High School.
Ownership History
Date
Name
Owned For
Owner Type
Purchase Details
Closed on
Dec 14, 2011
Sold by
Wendel Tara E
Bought by
Riddle David D
Current Estimated Value
Purchase Details
Closed on
Apr 21, 2004
Sold by
Rodgers Jacki A
Bought by
Riddle David D
Home Financials for this Owner
Home Financials are based on the most recent Mortgage that was taken out on this home.
Original Mortgage
$127,300
Interest Rate
5.46%
Mortgage Type
Purchase Money Mortgage
Purchase Details
Closed on
Aug 22, 1999
Sold by
Tenpas Bradley A and Tenpas Alison
Bought by
Rodgers Jacki
Home Financials for this Owner
Home Financials are based on the most recent Mortgage that was taken out on this home.
Original Mortgage
$86,000
Interest Rate
7.59%
Purchase Details
Closed on
Feb 8, 1997
Sold by
Uitermarkt Kenneth and Uitermarkt Fern L
Bought by
Tenpas Bradley A and Tenpas Alison
Create a Home Valuation Report for This Property
The Home Valuation Report is an in-depth analysis detailing your home's value as well as a comparison with similar homes in the area
Home Values in the Area
Average Home Value in this Area
Purchase History
| Date | Buyer | Sale Price | Title Company |
|---|---|---|---|
| Riddle David D | -- | None Available | |
| Riddle David D | $134,000 | -- | |
| Rodgers Jacki | $97,500 | -- | |
| Tenpas Bradley A | $66,500 | -- | |
| Tenpas Bradley A | $66,637 | -- | |
| Uitermarkt Kenneth | -- | -- |
Source: Public Records
Mortgage History
| Date | Status | Borrower | Loan Amount |
|---|---|---|---|
| Previous Owner | Riddle David D | $127,300 | |
| Previous Owner | Rodgers Jacki | $86,000 |
Source: Public Records
Tax History Compared to Growth
Tax History
| Year | Tax Paid | Tax Assessment Tax Assessment Total Assessment is a certain percentage of the fair market value that is determined by local assessors to be the total taxable value of land and additions on the property. | Land | Improvement |
|---|---|---|---|---|
| 2025 | $4,452 | $266,800 | $49,100 | $217,700 |
| 2024 | $4,452 | $236,800 | $43,500 | $193,300 |
| 2023 | $4,560 | $236,800 | $43,500 | $193,300 |
| 2022 | $4,524 | $202,400 | $38,500 | $163,900 |
| 2021 | $4,368 | $202,400 | $38,500 | $163,900 |
| 2020 | $4,532 | $183,600 | $35,100 | $148,500 |
| 2019 | $4,132 | $183,600 | $35,100 | $148,500 |
| 2018 | $4,086 | $162,300 | $30,700 | $131,600 |
| 2017 | $3,716 | $162,300 | $30,700 | $131,600 |
| 2016 | $3,614 | $145,900 | $27,500 | $118,400 |
| 2015 | $3,614 | $145,900 | $27,500 | $118,400 |
| 2014 | $3,436 | $138,000 | $24,000 | $114,000 |
Source: Public Records
Map
Nearby Homes