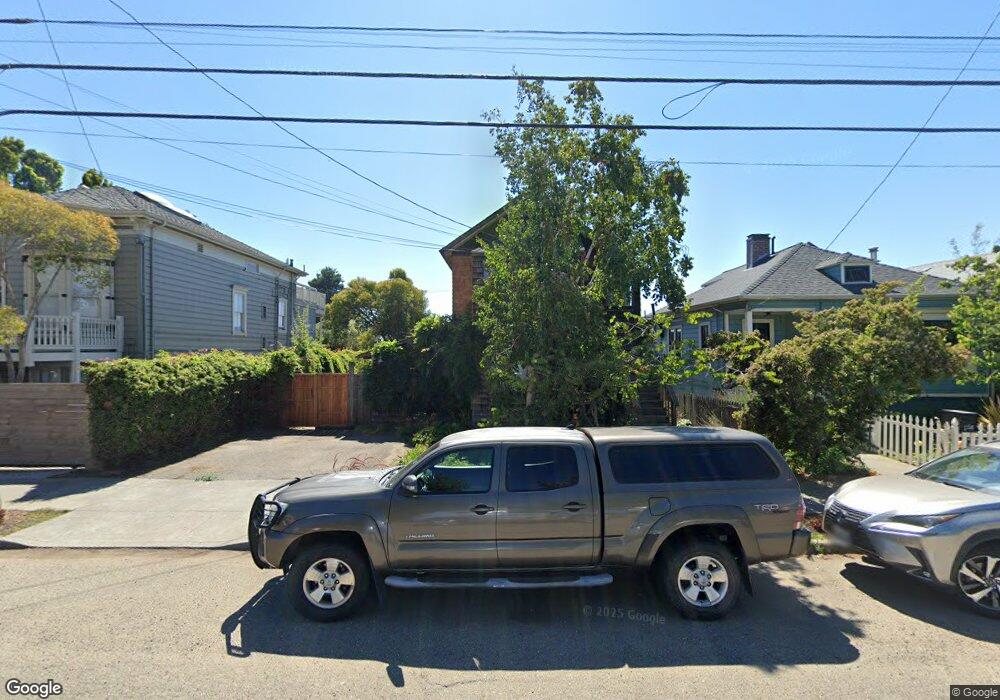
1512 5th St Berkeley, CA 94710
West Berkeley NeighborhoodEstimated Value: $845,000 - $1,226,728
2
Beds
2
Baths
1,878
Sq Ft
$549/Sq Ft
Est. Value
About This Home
This home is located at 1512 5th St, Berkeley, CA 94710 and is currently estimated at $1,031,182, approximately $549 per square foot. 1512 5th St is a home located in Alameda County with nearby schools including Rosa Parks Elementary School, Ruth Acty Elementary, and Berkeley Arts Magnet at Whittier School.
Ownership History
Date
Name
Owned For
Owner Type
Purchase Details
Closed on
Mar 3, 2009
Sold by
Friedland Steven M
Bought by
Friedland Steven and Steven Friedland Living Trust
Current Estimated Value
Purchase Details
Closed on
Feb 9, 1996
Sold by
Burns James S
Bought by
Friedland Steven
Create a Home Valuation Report for This Property
The Home Valuation Report is an in-depth analysis detailing your home's value as well as a comparison with similar homes in the area
Home Values in the Area
Average Home Value in this Area
Purchase History
| Date | Buyer | Sale Price | Title Company |
|---|---|---|---|
| Friedland Steven | -- | None Available | |
| Friedland Steven | $100,000 | Chicago Title Co |
Source: Public Records
Tax History
| Year | Tax Paid | Tax Assessment Tax Assessment Total Assessment is a certain percentage of the fair market value that is determined by local assessors to be the total taxable value of land and additions on the property. | Land | Improvement |
|---|---|---|---|---|
| 2025 | $6,440 | $201,774 | $99,462 | $102,312 |
| 2024 | $6,440 | $197,820 | $97,513 | $100,307 |
| 2023 | $6,226 | $193,941 | $95,601 | $98,340 |
| 2022 | $6,214 | $190,138 | $93,726 | $96,412 |
| 2021 | $6,186 | $186,410 | $91,889 | $94,521 |
| 2020 | $5,793 | $184,499 | $90,947 | $93,552 |
| 2019 | $5,474 | $180,881 | $89,163 | $91,718 |
| 2018 | $5,326 | $177,336 | $87,416 | $89,920 |
| 2017 | $5,110 | $173,859 | $85,702 | $88,157 |
| 2016 | $4,851 | $170,451 | $84,022 | $86,429 |
| 2015 | $4,757 | $167,891 | $82,760 | $85,131 |
| 2014 | $4,902 | $164,603 | $81,139 | $83,464 |
Source: Public Records
Map
Nearby Homes
- 817 Jones St
- 0 Camelia St Unit 41104882
- 995 Virginia St
- 1504 10th St
- 817 Delaware St
- 1729 8th St
- 940 Delaware St
- 1339 Kains Ave
- 1128 Delaware St
- 2010 9th St
- 2013 9th St
- 1728 Curtis St
- 1013 Addison St
- 1631 Belvedere Ave
- 1050 Allston Way
- 1919 Curtis St
- 1322 Virginia St
- 2220 7th St
- 2238 7th St
- 1114 Talbot Ave
Your Personal Tour Guide
Ask me questions while you tour the home.