Estimated Value: $59,000 - $76,000
3
Beds
1
Bath
960
Sq Ft
$70/Sq Ft
Est. Value
About This Home
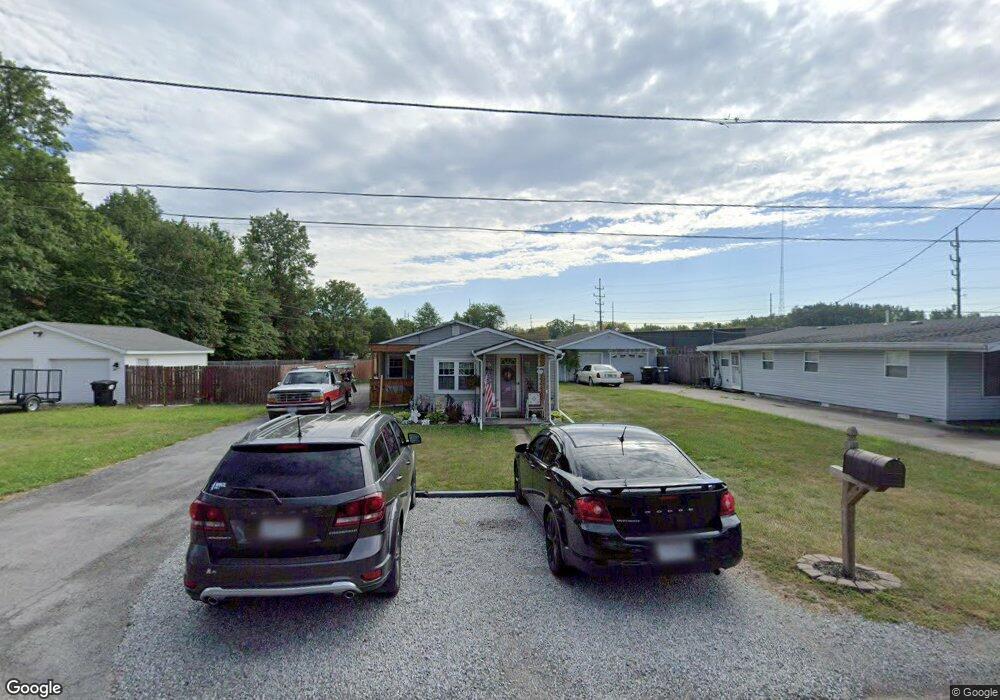
This home is located at 1512 Adams St, Lima, OH 45801 and is currently estimated at $66,723, approximately $69 per square foot. 1512 Adams St is a home located in Allen County with nearby schools including Bath Elementary School, Bath Middle School, and Bath High School.
Ownership History
Date
Name
Owned For
Owner Type
Purchase Details
Closed on
Sep 26, 2017
Sold by
Michael Ricky E
Bought by
Smith Michael and Smith Kimberly A
Current Estimated Value
Home Financials for this Owner
Home Financials are based on the most recent Mortgage that was taken out on this home.
Original Mortgage
$42,750
Outstanding Balance
$23,286
Interest Rate
3.89%
Mortgage Type
New Conventional
Estimated Equity
$43,437
Purchase Details
Closed on
Nov 7, 2013
Sold by
Highland James F
Bought by
Michael Ricky E
Purchase Details
Closed on
Apr 12, 2010
Sold by
Hardesty Enterprises Llc
Bought by
Highland James F
Home Financials for this Owner
Home Financials are based on the most recent Mortgage that was taken out on this home.
Original Mortgage
$25,600
Interest Rate
5.1%
Mortgage Type
Purchase Money Mortgage
Purchase Details
Closed on
Jun 19, 1992
Bought by
Stephens Carl Ordes
Create a Home Valuation Report for This Property
The Home Valuation Report is an in-depth analysis detailing your home's value as well as a comparison with similar homes in the area
Purchase History
| Date | Buyer | Sale Price | Title Company |
|---|---|---|---|
| Smith Michael | $45,000 | None Available | |
| Michael Ricky E | $30,000 | None Available | |
| Highland James F | $32,000 | None Available | |
| Stephens Carl Ordes | $30,800 | -- |
Source: Public Records
Mortgage History
| Date | Status | Borrower | Loan Amount |
|---|---|---|---|
| Open | Smith Michael | $42,750 | |
| Previous Owner | Highland James F | $25,600 |
Source: Public Records
Tax History
| Year | Tax Paid | Tax Assessment Tax Assessment Total Assessment is a certain percentage of the fair market value that is determined by local assessors to be the total taxable value of land and additions on the property. | Land | Improvement |
|---|---|---|---|---|
| 2024 | $831 | $17,850 | $1,470 | $16,380 |
| 2023 | $819 | $17,010 | $1,400 | $15,610 |
| 2022 | $818 | $17,010 | $1,400 | $15,610 |
| 2021 | $802 | $17,010 | $1,400 | $15,610 |
| 2020 | $673 | $12,710 | $1,330 | $11,380 |
| 2019 | $673 | $12,710 | $1,330 | $11,380 |
| 2018 | $662 | $12,710 | $1,330 | $11,380 |
| 2017 | $590 | $11,380 | $1,330 | $10,050 |
| 2016 | $584 | $11,380 | $1,330 | $10,050 |
| 2015 | $566 | $11,380 | $1,330 | $10,050 |
| 2014 | $566 | $10,920 | $1,330 | $9,590 |
| 2013 | $567 | $10,920 | $1,330 | $9,590 |
Source: Public Records
Map
Nearby Homes
- 812 Christopher Dr
- 1435 N Central Ave
- 1503 Findlay Rd Unit Lot 6
- 922 N Jefferson St
- 207 W Lane Ave
- 919 N Main St
- 735 N Elizabeth St
- 1021 N McDonel St
- 1705 Karen St
- 316 Ewing Ave
- 406 Ewing Ave
- 1889 N Metcalf St
- 576 W Ashton Ave
- 557 W Ashton Ave
- 1212 Virginia Ave
- 608 W O'Connor Ave
- 1656 Stewart Rd
- 1317 Virginia Ave
- 514 & 516 N Elizabeth St
- 645 W O'Connor Ave
Your Personal Tour Guide
Ask me questions while you tour the home.