1512 Beech Ave Torrance, CA 90501
East Torrance NeighborhoodEstimated Value: $891,989 - $1,351,000
5
Beds
3
Baths
2,291
Sq Ft
$507/Sq Ft
Est. Value
About This Home
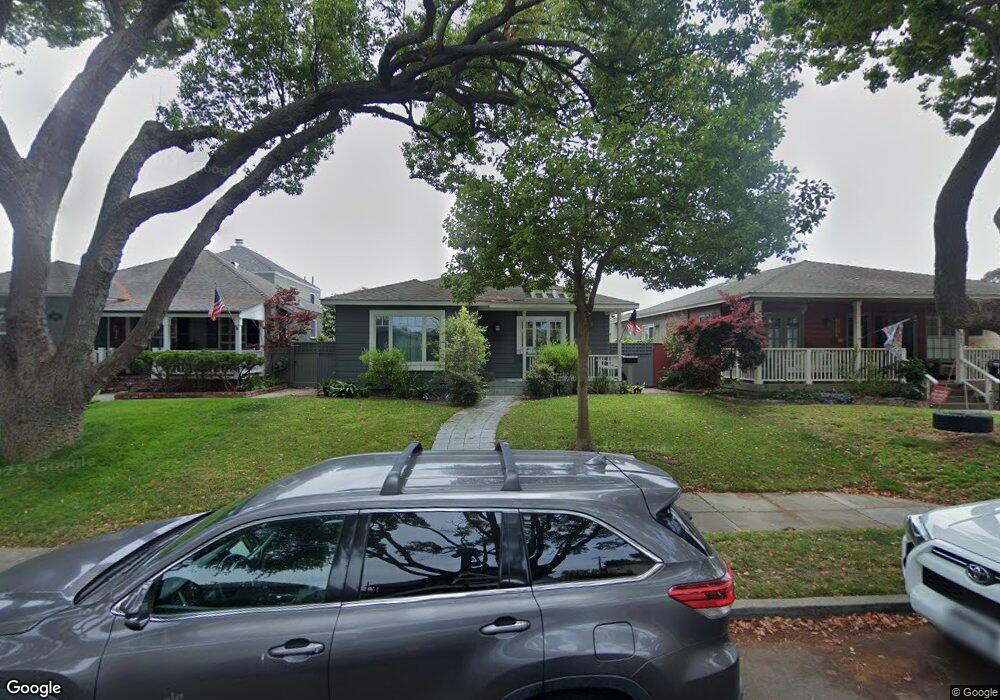
This home is located at 1512 Beech Ave, Torrance, CA 90501 and is currently estimated at $1,161,747, approximately $507 per square foot. 1512 Beech Ave is a home located in Los Angeles County with nearby schools including Fern Elementary School, Madrona Middle School, and Torrance High School.
Ownership History
Date
Name
Owned For
Owner Type
Purchase Details
Closed on
May 24, 2017
Sold by
Filippone Regina
Bought by
Elliott Robert
Current Estimated Value
Purchase Details
Closed on
Oct 3, 2008
Sold by
Elliott Robert H
Bought by
Elliott Robert H and Filippone Elliott Regina E
Purchase Details
Closed on
Jan 29, 1996
Sold by
Davis Vincent D
Bought by
Elliott Robert H
Home Financials for this Owner
Home Financials are based on the most recent Mortgage that was taken out on this home.
Original Mortgage
$189,550
Outstanding Balance
$6,221
Interest Rate
7.04%
Estimated Equity
$1,155,526
Purchase Details
Closed on
Jul 18, 1995
Sold by
Davis Mary Ann
Bought by
Davis Mary Ann and Davis Vincent Dan
Purchase Details
Closed on
Jul 14, 1993
Sold by
Davis Donald D
Bought by
Davis Donald D and Davis Mary Ann
Create a Home Valuation Report for This Property
The Home Valuation Report is an in-depth analysis detailing your home's value as well as a comparison with similar homes in the area
Home Values in the Area
Average Home Value in this Area
Purchase History
| Date | Buyer | Sale Price | Title Company |
|---|---|---|---|
| Elliott Robert | -- | None Available | |
| Elliott Robert H | -- | Accommodation | |
| Elliott Robert H | $223,000 | Commonwealth Land Title Co | |
| Davis Mary Ann | -- | -- | |
| Davis Donald D | -- | -- |
Source: Public Records
Mortgage History
| Date | Status | Borrower | Loan Amount |
|---|---|---|---|
| Open | Elliott Robert H | $189,550 |
Source: Public Records
Tax History Compared to Growth
Tax History
| Year | Tax Paid | Tax Assessment Tax Assessment Total Assessment is a certain percentage of the fair market value that is determined by local assessors to be the total taxable value of land and additions on the property. | Land | Improvement |
|---|---|---|---|---|
| 2025 | $7,151 | $613,755 | $267,616 | $346,139 |
| 2024 | $7,151 | $601,721 | $262,369 | $339,352 |
| 2023 | $4,591 | $375,906 | $257,225 | $118,681 |
| 2022 | $4,530 | $368,536 | $252,182 | $116,354 |
| 2021 | $4,443 | $361,311 | $247,238 | $114,073 |
| 2019 | $4,318 | $350,596 | $239,905 | $110,691 |
| 2018 | $4,153 | $343,722 | $235,201 | $108,521 |
| 2017 | $93 | $336,984 | $230,590 | $106,394 |
| 2016 | $3,963 | $330,377 | $226,069 | $104,308 |
| 2015 | $3,877 | $325,416 | $222,674 | $102,742 |
| 2014 | $3,783 | $319,043 | $218,313 | $100,730 |
Source: Public Records
Map
Nearby Homes
- 2363 Torrance Blvd
- 2558 Torrance Blvd
- 1800 Oak St Unit 200
- 2567 Plaza Del Amo Unit 109
- 2571 Plaza Del Amo Unit 310
- 2571 Plaza Del Amo Unit 107
- 2367 Jefferson St Unit 112
- 2303 Jefferson St Unit 1215
- 2555 Plaza Del Amo Unit R
- 2559 Plaza Del Amo Unit 207
- 1633 Hickory Ave
- 1424 Post Ave
- 2119 Shelburne Way
- 625 Amapola Ave
- 1021 Cravens Ave Unit 9
- 2123 Shelburne Way Unit 29
- 1534 Marcelina Ave Unit B
- 2889 Plaza Del Amo Unit 202
- 2801 Sepulveda Blvd Unit 34
- 2801 Sepulveda Blvd Unit 50
- 1516 Beech Ave
- 1520 Beech Ave Unit 1/2
- 1520 Beech Ave
- 1504 Beech Ave
- 1424 Beech Ave
- 2417 Sonoma St
- 1420 Beech Ave
- 1511 Acacia Ave
- 1507 Acacia Ave
- 1515 Acacia Ave
- 2415 Sonoma St
- 1503 Acacia Ave
- 1519 Acacia Ave
- 1519 Beech Ave
- 1511 Beech Ave
- 1416 Beech Ave
- 1423 Acacia Ave
- 1507 Beech Ave
- 1515 Beech Ave
- 1503 Beech Ave