1512 Castle Wall St Las Vegas, NV 89117
Canyon Gate NeighborhoodEstimated Value: $886,100 - $1,098,000
4
Beds
4
Baths
3,049
Sq Ft
$314/Sq Ft
Est. Value
About This Home
This home is located at 1512 Castle Wall St, Las Vegas, NV 89117 and is currently estimated at $956,525, approximately $313 per square foot. 1512 Castle Wall St is a home located in Clark County with nearby schools including Herbert A. Derfelt Elementary School, Walter Johnson Junior High School Academy of International Studies, and Bonanza High School.
Ownership History
Date
Name
Owned For
Owner Type
Purchase Details
Closed on
Aug 8, 2005
Sold by
Flaherty Andrew M
Bought by
Brzyszko Stanley and Brzyszko Christine
Current Estimated Value
Home Financials for this Owner
Home Financials are based on the most recent Mortgage that was taken out on this home.
Original Mortgage
$417,000
Outstanding Balance
$217,646
Interest Rate
5.56%
Mortgage Type
Seller Take Back
Estimated Equity
$738,879
Purchase Details
Closed on
Apr 4, 2002
Sold by
Flaherty Sonja M
Bought by
Flaherty Andrew M and Andrew M Flaherty Living Trust
Purchase Details
Closed on
Oct 9, 1998
Sold by
Flaherty Andrew M and Flaherty Sonja M
Bought by
Flaherty Andrew M and Andrew M Flaherty Living Trust
Purchase Details
Closed on
Dec 11, 1995
Sold by
Castlegate Ltd Partnership
Bought by
Flaherty Andrew M and Flaherty Sonja M
Home Financials for this Owner
Home Financials are based on the most recent Mortgage that was taken out on this home.
Original Mortgage
$204,955
Interest Rate
7.38%
Create a Home Valuation Report for This Property
The Home Valuation Report is an in-depth analysis detailing your home's value as well as a comparison with similar homes in the area
Home Values in the Area
Average Home Value in this Area
Purchase History
| Date | Buyer | Sale Price | Title Company |
|---|---|---|---|
| Brzyszko Stanley | $702,000 | Chicago Title | |
| Flaherty Andrew M | -- | United Title | |
| Flaherty Andrew M | -- | United Title | |
| Flaherty Andrew M | $256,500 | -- |
Source: Public Records
Mortgage History
| Date | Status | Borrower | Loan Amount |
|---|---|---|---|
| Open | Brzyszko Stanley | $417,000 | |
| Previous Owner | Flaherty Andrew M | $204,955 |
Source: Public Records
Tax History Compared to Growth
Tax History
| Year | Tax Paid | Tax Assessment Tax Assessment Total Assessment is a certain percentage of the fair market value that is determined by local assessors to be the total taxable value of land and additions on the property. | Land | Improvement |
|---|---|---|---|---|
| 2025 | $4,619 | $208,567 | $70,350 | $138,217 |
| 2024 | $4,485 | $208,567 | $70,350 | $138,217 |
| 2023 | $3,660 | $190,348 | $59,500 | $130,848 |
| 2022 | $4,354 | $177,885 | $57,750 | $120,135 |
| 2021 | $4,227 | $165,601 | $51,100 | $114,501 |
| 2020 | $4,101 | $158,287 | $44,450 | $113,837 |
| 2019 | $3,982 | $154,723 | $42,350 | $112,373 |
| 2018 | $3,866 | $148,956 | $40,250 | $108,706 |
| 2017 | $4,939 | $150,671 | $40,250 | $110,421 |
| 2016 | $3,660 | $143,313 | $31,500 | $111,813 |
| 2015 | $3,653 | $134,398 | $24,500 | $109,898 |
| 2014 | $3,547 | $109,954 | $24,500 | $85,454 |
Source: Public Records
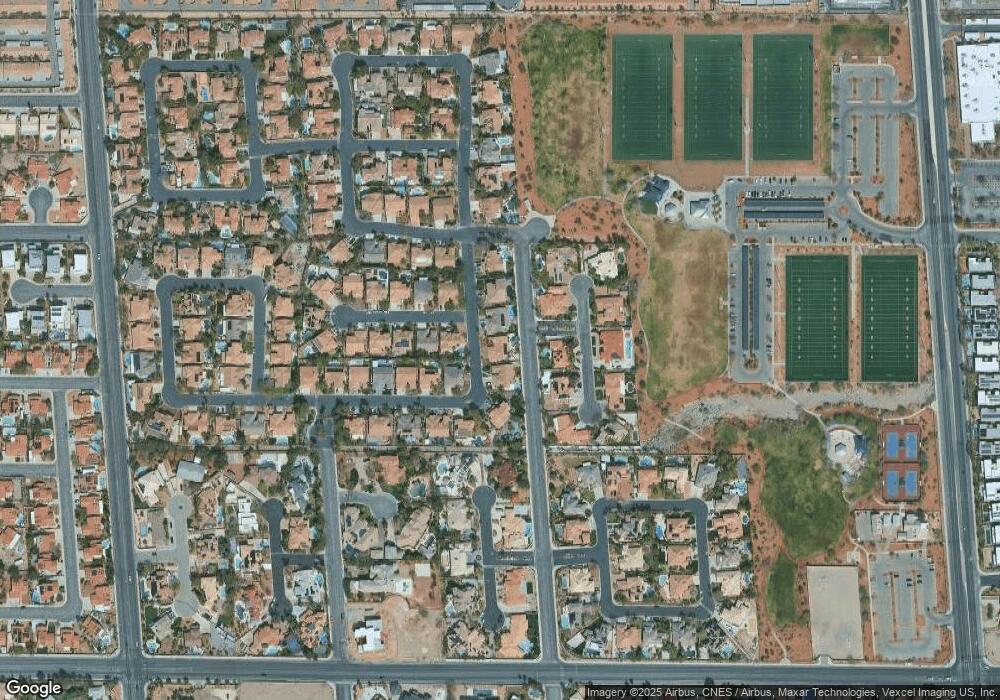
Map
Nearby Homes
- 8000 Clock Tower Ct
- 8113 Gothic Ave
- 1720 Oval Cir
- 7808 Foothill Ash Ave
- 1700 Fairgate Ct
- 1704 River Birch St
- 1448 Canyon Ledge Ct
- 8005 Sandmark Dr
- 1617 Marbella Ridge Ct
- 1721 S Tioga Way
- 2101 Diamond Bar Dr
- 2110 Americas Cup Cir
- 7803 Canoe Ln
- 2131 Diamond Bar Dr
- 8021 Obannon Dr
- 2010 S Buffalo Dr
- 1931 Pago Ct
- 1890 Pago Ct
- 1004 Sun Wood Dr
- 1000 Grammy Dr
- 1508 Castle Wall St
- 1516 Castle Wall St
- 7901 Clock Tower Ct
- 7900 Gothic Ave
- 1459 Danyelle Ct
- 1520 Castle Wall St
- 7905 Clock Tower Ct
- 1455 Danyelle Ct
- 7900 Clock Tower Ct
- 7904 Gothic Ave
- 1463 Danyelle Ct
- 7901 Gothic Ave
- 1500 Castle Wall St
- 7904 Clock Tower Ct
- 7909 Clock Tower Ct
- 8000 Gothic Ave
- 7905 Gothic Ave
- 1451 Danyelle Ct
- 7901 Del Rey Ave
- 1467 Danyelle Ct