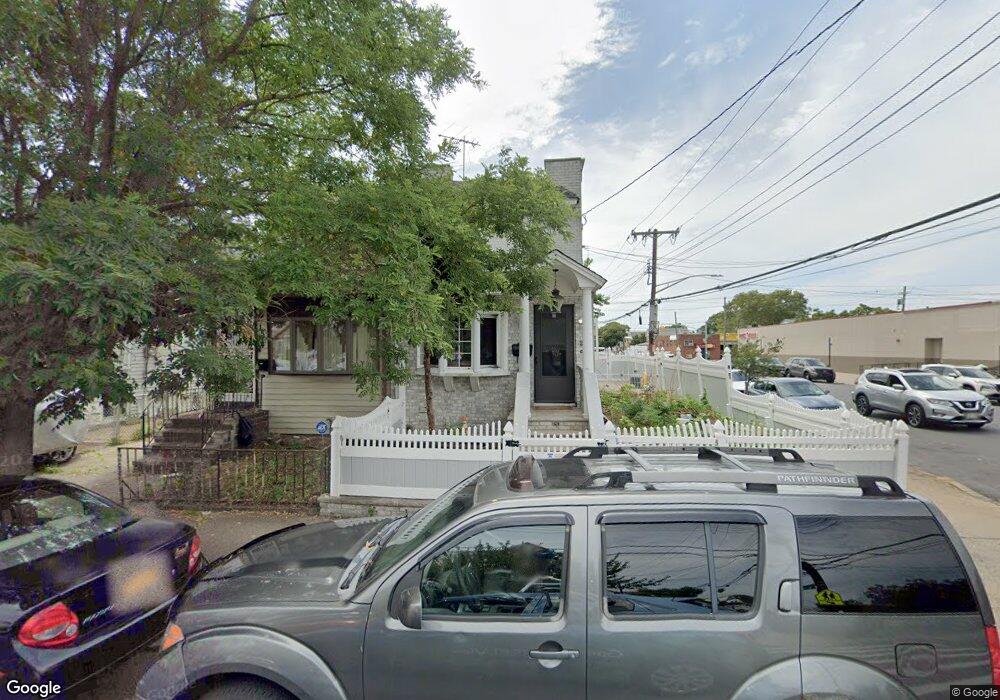
1512 E 51st St Brooklyn, NY 11234
Flatlands NeighborhoodEstimated Value: $579,661 - $680,000
2
Beds
2
Baths
868
Sq Ft
$700/Sq Ft
Est. Value
About This Home
This home is located at 1512 E 51st St, Brooklyn, NY 11234 and is currently estimated at $607,415, approximately $699 per square foot. 1512 E 51st St is a home located in Kings County with nearby schools including P.S. 203 Floyd Bennett, Midwood Catholic Academy, and Christian Heritage Academy.
Ownership History
Date
Name
Owned For
Owner Type
Purchase Details
Closed on
Dec 8, 2021
Sold by
Jac Equities Llc
Bought by
Chowdhury Nouros
Current Estimated Value
Home Financials for this Owner
Home Financials are based on the most recent Mortgage that was taken out on this home.
Original Mortgage
$432,000
Outstanding Balance
$397,327
Interest Rate
3.11%
Mortgage Type
Purchase Money Mortgage
Estimated Equity
$210,088
Purchase Details
Closed on
Sep 12, 2019
Sold by
Beharry Sabitree and Bequin Martha
Bought by
J A C Equities Llc
Home Financials for this Owner
Home Financials are based on the most recent Mortgage that was taken out on this home.
Original Mortgage
$150,000
Interest Rate
3.6%
Purchase Details
Closed on
Jun 11, 2019
Sold by
Crespo Equities Llc
Bought by
Beharry Sabitree and Bequin Martha
Purchase Details
Closed on
May 11, 2017
Sold by
Beharry Sabitree and Bequin Martha
Bought by
Crespo Equities Llc
Purchase Details
Closed on
Oct 12, 2001
Sold by
Arena Frank and Hall Arleatta P
Bought by
Berquin Sabitree and Berquin Martha
Home Financials for this Owner
Home Financials are based on the most recent Mortgage that was taken out on this home.
Original Mortgage
$189,805
Interest Rate
6.7%
Create a Home Valuation Report for This Property
The Home Valuation Report is an in-depth analysis detailing your home's value as well as a comparison with similar homes in the area
Home Values in the Area
Average Home Value in this Area
Purchase History
| Date | Buyer | Sale Price | Title Company |
|---|---|---|---|
| Chowdhury Nouros | $540,000 | -- | |
| J A C Equities Llc | $300,000 | -- | |
| Beharry Sabitree | -- | -- | |
| Crespo Equities Llc | $275,000 | -- | |
| Berquin Sabitree | -- | -- |
Source: Public Records
Mortgage History
| Date | Status | Borrower | Loan Amount |
|---|---|---|---|
| Open | Chowdhury Nouros | $432,000 | |
| Previous Owner | J A C Equities Llc | $150,000 | |
| Previous Owner | Berquin Sabitree | $189,805 |
Source: Public Records
Tax History
| Year | Tax Paid | Tax Assessment Tax Assessment Total Assessment is a certain percentage of the fair market value that is determined by local assessors to be the total taxable value of land and additions on the property. | Land | Improvement |
|---|---|---|---|---|
| 2025 | $4,894 | $39,240 | $6,300 | $32,940 |
| 2024 | $4,894 | $35,340 | $6,300 | $29,040 |
| 2023 | $4,668 | $38,820 | $6,300 | $32,520 |
| 2022 | $4,329 | $34,800 | $6,300 | $28,500 |
| 2021 | $4,437 | $28,440 | $6,300 | $22,140 |
| 2019 | $3,875 | $26,040 | $6,300 | $19,740 |
| 2018 | $3,607 | $19,155 | $5,066 | $14,089 |
| 2017 | $3,384 | $18,072 | $4,929 | $13,143 |
| 2016 | $3,202 | $17,568 | $5,394 | $12,174 |
| 2015 | $1,836 | $17,568 | $5,710 | $11,858 |
| 2014 | $1,836 | $16,920 | $6,599 | $10,321 |
Source: Public Records
Map
Nearby Homes
- 1530 E 51st St
- 1511 E 51st St
- 1500 E 51st St
- 1448 E 53rd St
- 1454 E 53rd St
- 5001 Avenue M
- 1434 E 52nd St
- 1433 E 52nd St Unit G
- 1433 E 52nd St Unit 2B
- 4916 Avenue M
- 1411 E 53rd St
- 5206 Avenue M
- 1615 E 51st St
- 4809 Avenue M
- 5216 Avenue M
- 1582 E 52nd St
- 2098 Utica Ave
- 2037 Schenectady Ave
- 1419 E 54th St
- 1647 E 49th St
Your Personal Tour Guide
Ask me questions while you tour the home.