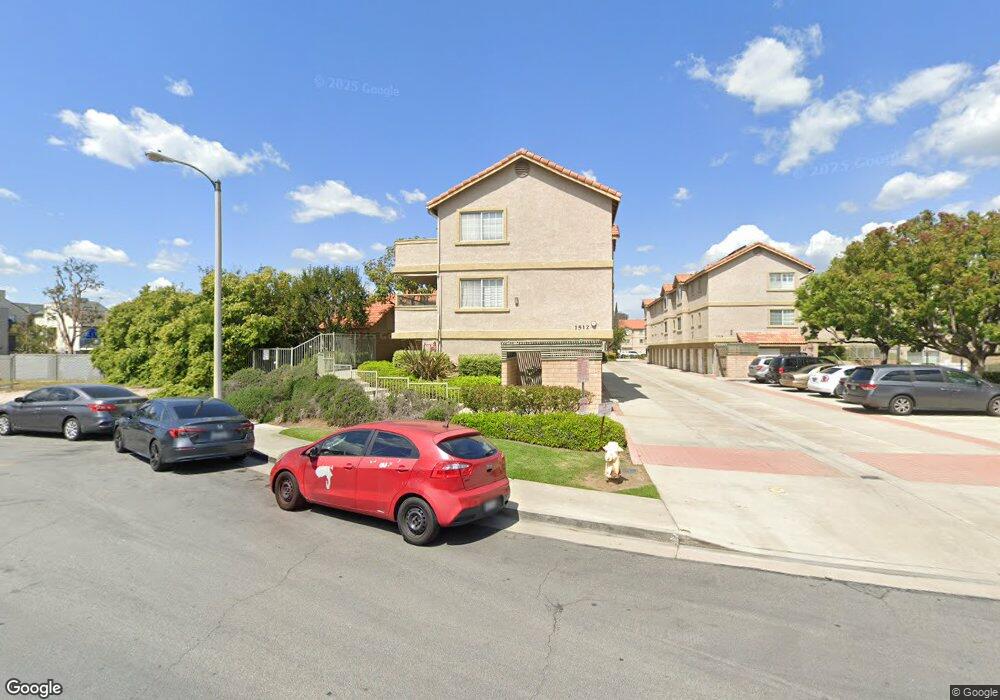
1512 E Spruce St Unit E4 Placentia, CA 92870
Estimated Value: $550,000 - $588,000
2
Beds
2
Baths
870
Sq Ft
$659/Sq Ft
Est. Value
About This Home
This home is located at 1512 E Spruce St Unit E4, Placentia, CA 92870 and is currently estimated at $573,299, approximately $658 per square foot. 1512 E Spruce St Unit E4 is a home located in Orange County with nearby schools including Van Buren Elementary School, Kraemer Middle School, and Valencia High School.
Ownership History
Date
Name
Owned For
Owner Type
Purchase Details
Closed on
Apr 15, 2020
Sold by
Underwood Jennifer M
Bought by
Underwood Jennifer M and The Jennifer M Underwood Famil
Current Estimated Value
Purchase Details
Closed on
Jan 18, 2020
Sold by
Underwood Jennifer M
Bought by
Underwood Jennifer M and Jennifer M Underwood Family Tr
Purchase Details
Closed on
Dec 20, 2011
Sold by
Port Richard
Bought by
Underwood Jennifer
Home Financials for this Owner
Home Financials are based on the most recent Mortgage that was taken out on this home.
Original Mortgage
$169,100
Outstanding Balance
$114,951
Interest Rate
3.88%
Mortgage Type
New Conventional
Estimated Equity
$458,348
Purchase Details
Closed on
Mar 30, 1995
Sold by
Ladezar Inc
Bought by
Port Richard
Home Financials for this Owner
Home Financials are based on the most recent Mortgage that was taken out on this home.
Original Mortgage
$105,700
Interest Rate
8.9%
Create a Home Valuation Report for This Property
The Home Valuation Report is an in-depth analysis detailing your home's value as well as a comparison with similar homes in the area
Home Values in the Area
Average Home Value in this Area
Purchase History
| Date | Buyer | Sale Price | Title Company |
|---|---|---|---|
| Underwood Jennifer M | -- | None Available | |
| Underwood Jennifer M | -- | None Available | |
| Underwood Jennifer | $178,000 | First American Title Co | |
| Port Richard | $110,000 | Chicago Title Company |
Source: Public Records
Mortgage History
| Date | Status | Borrower | Loan Amount |
|---|---|---|---|
| Open | Underwood Jennifer | $169,100 | |
| Previous Owner | Port Richard | $105,700 |
Source: Public Records
Tax History
| Year | Tax Paid | Tax Assessment Tax Assessment Total Assessment is a certain percentage of the fair market value that is determined by local assessors to be the total taxable value of land and additions on the property. | Land | Improvement |
|---|---|---|---|---|
| 2025 | $2,734 | $223,570 | $104,989 | $118,581 |
| 2024 | $2,734 | $219,187 | $102,931 | $116,256 |
| 2023 | $2,686 | $214,890 | $100,913 | $113,977 |
| 2022 | $2,661 | $210,677 | $98,934 | $111,743 |
| 2021 | $2,618 | $206,547 | $96,995 | $109,552 |
| 2020 | $2,622 | $204,430 | $96,001 | $108,429 |
| 2019 | $2,538 | $200,422 | $94,119 | $106,303 |
| 2018 | $2,508 | $196,493 | $92,274 | $104,219 |
| 2017 | $2,469 | $192,641 | $90,465 | $102,176 |
| 2016 | $2,422 | $188,864 | $88,691 | $100,173 |
| 2015 | $2,393 | $186,028 | $87,359 | $98,669 |
| 2014 | $2,325 | $182,384 | $85,647 | $96,737 |
Source: Public Records
Map
Nearby Homes
- 1500 E Spruce St Unit D
- 1593 Ismail Place
- 1582 Topeka Ave
- 1460 Holcomb Place Unit 23
- 1571 Lima Way Unit 5
- 1572 Lima Way Unit 6
- 1663 Oak St
- 1645 La Paloma Ave
- 1527 E Evans Ln
- 5750 Sugar Pine Dr
- 1302 Belfi Ln
- 1982 Orchard Dr
- 17541 Pine Cir
- 603 Patten Ave
- 17792 Neff Ranch Rd
- 607 Patten Ave
- 605 Patten Ave
- 1270 E Providence Loop
- 611 Patten Ave
- 1171 Curie Ln
- 1512 E Spruce St Unit B
- 1512 E Spruce St Unit A
- 1512 E Spruce St Unit D
- 1512 E Spruce St Unit E2
- 1512 E Spruce St Unit C
- 1512 E Spruce St Unit E1
- 1506 E Spruce St Unit B
- 1518 E Spruce St Unit A
- 1518 E Spruce St Unit A1
- 1518 E Spruce St
- 1518 E Spruce St Unit E
- 1518 E Spruce St Unit C
- 1518 E Spruce St Unit F3
- 1518 E Spruce St Unit F2
- 1518 E Spruce St Unit F4
- 1518 E Spruce St Unit F1
- 1518 E Spruce St Unit F5
- 1518 E Spruce St Unit F6
- 1500 E Spruce St Unit B
Your Personal Tour Guide
Ask me questions while you tour the home.