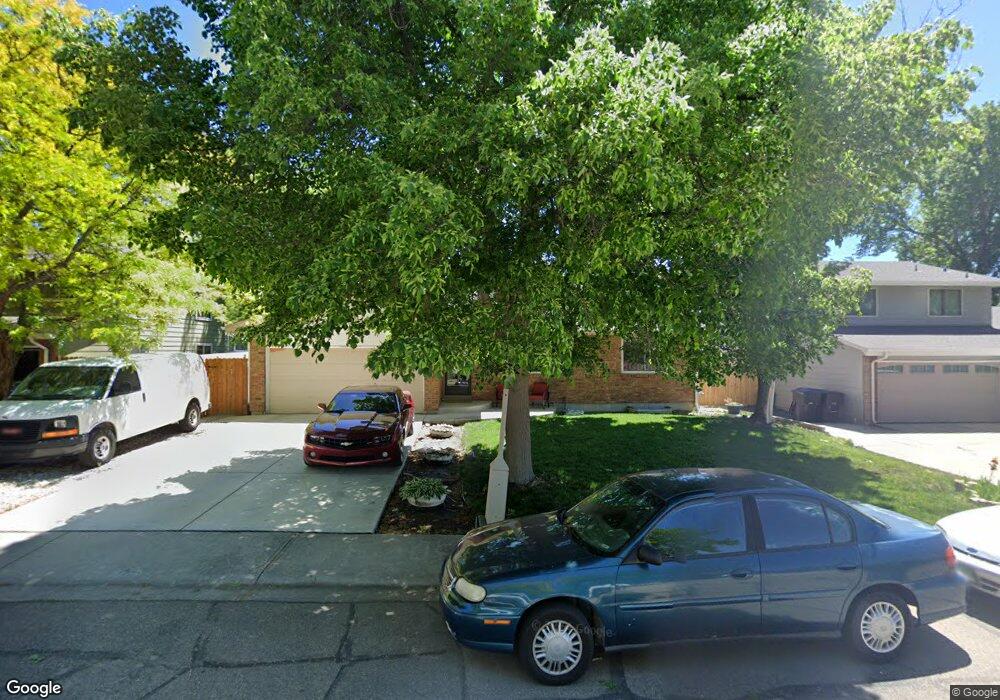
1512 Elmhurst Dr Longmont, CO 80503
Longmont Estates NeighborhoodEstimated Value: $503,000 - $561,000
3
Beds
2
Baths
1,525
Sq Ft
$344/Sq Ft
Est. Value
About This Home
This home is located at 1512 Elmhurst Dr, Longmont, CO 80503 and is currently estimated at $523,899, approximately $343 per square foot. 1512 Elmhurst Dr is a home located in Boulder County with nearby schools including Longmont Estates Elementary School, Westview Middle School, and Silver Creek High School.
Ownership History
Date
Name
Owned For
Owner Type
Purchase Details
Closed on
Sep 10, 2007
Sold by
Fishback Carol J and Fresquez Brian C
Bought by
Fishback Carol J
Current Estimated Value
Home Financials for this Owner
Home Financials are based on the most recent Mortgage that was taken out on this home.
Original Mortgage
$209,400
Outstanding Balance
$133,594
Interest Rate
6.72%
Mortgage Type
Purchase Money Mortgage
Estimated Equity
$390,305
Purchase Details
Closed on
May 11, 1998
Sold by
Martin Donald W and Martin Marcella A
Bought by
Smith Barbara Loraine
Home Financials for this Owner
Home Financials are based on the most recent Mortgage that was taken out on this home.
Original Mortgage
$130,000
Interest Rate
7.18%
Purchase Details
Closed on
Jan 7, 1981
Bought by
Fishback Carol J
Purchase Details
Closed on
Sep 7, 1979
Bought by
Fishback Carol J
Create a Home Valuation Report for This Property
The Home Valuation Report is an in-depth analysis detailing your home's value as well as a comparison with similar homes in the area
Home Values in the Area
Average Home Value in this Area
Purchase History
| Date | Buyer | Sale Price | Title Company |
|---|---|---|---|
| Fishback Carol J | -- | Utc Colorado | |
| Fishback Carol J | $209,900 | Utc Colorado | |
| Smith Barbara Loraine | $152,500 | -- | |
| Fishback Carol J | $75,500 | -- | |
| Fishback Carol J | $55,700 | -- |
Source: Public Records
Mortgage History
| Date | Status | Borrower | Loan Amount |
|---|---|---|---|
| Open | Fishback Carol J | $209,400 | |
| Previous Owner | Smith Barbara Loraine | $130,000 |
Source: Public Records
Tax History Compared to Growth
Tax History
| Year | Tax Paid | Tax Assessment Tax Assessment Total Assessment is a certain percentage of the fair market value that is determined by local assessors to be the total taxable value of land and additions on the property. | Land | Improvement |
|---|---|---|---|---|
| 2025 | $3,119 | $33,194 | $7,963 | $25,231 |
| 2024 | $3,119 | $33,194 | $7,963 | $25,231 |
| 2023 | $3,076 | $32,602 | $8,884 | $27,403 |
| 2022 | $2,718 | $27,467 | $6,846 | $20,621 |
| 2021 | $2,753 | $28,257 | $7,043 | $21,214 |
| 2020 | $2,473 | $25,454 | $5,720 | $19,734 |
| 2019 | $2,434 | $25,454 | $5,720 | $19,734 |
| 2018 | $2,066 | $21,751 | $5,760 | $15,991 |
| 2017 | $2,038 | $24,047 | $6,368 | $17,679 |
| 2016 | $1,882 | $19,693 | $7,721 | $11,972 |
| 2015 | $1,794 | $16,636 | $4,298 | $12,338 |
| 2014 | $1,554 | $16,636 | $4,298 | $12,338 |
Source: Public Records
Map
Nearby Homes
- 1451 Elmhurst Dr
- 1448 Elmhurst Ct
- 1460 Belmont Dr
- 2325 15th Ave
- 2623 Elmhurst Cir
- 1506 Fisk Ct
- 2871 Humboldt Cir
- 1379 Charles Dr Unit 7
- 1379 Charles Dr Unit 4
- 1379 Charles Dr Unit 5
- 1379 Charles Dr Unit 3
- 1406 Hover St
- 2888 Humboldt Cir
- 2810 Humboldt Cir
- 1350 Stuart St
- 1429 Auburn Ct
- 1835 Cambridge Dr
- 1262 Lanyon Ln
- 1345 Northwestern Rd
- 1221 Kiteley Ln
- 1506 Elmhurst Dr
- 1518 Elmhurst Dr
- 1512 Denison Cir
- 1506 Denison Cir
- 1518 Denison Cir
- 1500 Elmhurst Dr
- 1524 Elmhurst Dr
- 1507 Elmhurst Dr
- 1524 Denison Cir
- 2520 15th Ave
- 1501 Elmhurst Dr
- 1521 Elmhurst Dr
- 1528 Elmhurst Dr
- 1530 Denison Cir
- 1531 Elmhurst Dr
- 1513 Denison Cir
- 1519 Denison Cir
- 1507 Denison Cir
- 2614 15th Ave
- 2610 15th Ave