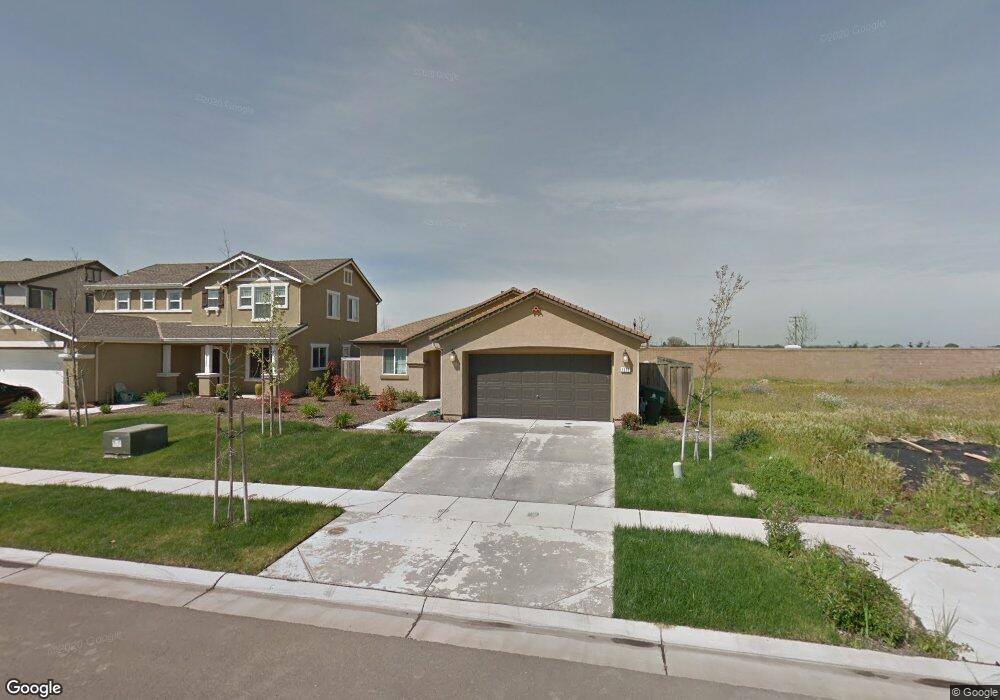
1512 Garnet Way Unit 555 Olivehurst, CA 95961
Estimated Value: $412,000 - $438,000
3
Beds
2
Baths
1,337
Sq Ft
$315/Sq Ft
Est. Value
About This Home
This home is located at 1512 Garnet Way Unit 555, Olivehurst, CA 95961 and is currently estimated at $420,919, approximately $314 per square foot. 1512 Garnet Way Unit 555 is a home located in Yuba County with nearby schools including Cobblestone Elementary School, Rio Del Oro Elementary School, and Riverside Meadows Intermediate School.
Ownership History
Date
Name
Owned For
Owner Type
Purchase Details
Closed on
Jun 18, 2019
Sold by
Keeling Andrew J
Bought by
Losee Joseph and Losee Rachel
Current Estimated Value
Home Financials for this Owner
Home Financials are based on the most recent Mortgage that was taken out on this home.
Original Mortgage
$295,000
Outstanding Balance
$259,377
Interest Rate
4.1%
Mortgage Type
VA
Estimated Equity
$161,542
Purchase Details
Closed on
Mar 12, 2014
Sold by
Oneil Sean M
Bought by
Keeling Andrew
Home Financials for this Owner
Home Financials are based on the most recent Mortgage that was taken out on this home.
Original Mortgage
$187,445
Interest Rate
4.25%
Mortgage Type
VA
Purchase Details
Closed on
May 21, 2010
Sold by
Kb Home Sacramento Inc
Bought by
Oneil Sean M
Home Financials for this Owner
Home Financials are based on the most recent Mortgage that was taken out on this home.
Original Mortgage
$166,260
Interest Rate
5.21%
Mortgage Type
New Conventional
Create a Home Valuation Report for This Property
The Home Valuation Report is an in-depth analysis detailing your home's value as well as a comparison with similar homes in the area
Home Values in the Area
Average Home Value in this Area
Purchase History
| Date | Buyer | Sale Price | Title Company |
|---|---|---|---|
| Losee Joseph | $295,000 | First American Title Company | |
| Keeling Andrew | $183,500 | First American Title Company | |
| Oneil Sean M | $163,000 | First American Title Company |
Source: Public Records
Mortgage History
| Date | Status | Borrower | Loan Amount |
|---|---|---|---|
| Open | Losee Joseph | $295,000 | |
| Previous Owner | Keeling Andrew | $187,445 | |
| Previous Owner | Oneil Sean M | $166,260 |
Source: Public Records
Tax History Compared to Growth
Tax History
| Year | Tax Paid | Tax Assessment Tax Assessment Total Assessment is a certain percentage of the fair market value that is determined by local assessors to be the total taxable value of land and additions on the property. | Land | Improvement |
|---|---|---|---|---|
| 2025 | $5,528 | $329,072 | $72,505 | $256,567 |
| 2023 | $5,528 | $316,296 | $69,691 | $246,605 |
| 2022 | $5,313 | $310,095 | $68,325 | $241,770 |
| 2021 | $5,158 | $304,016 | $66,986 | $237,030 |
| 2020 | $5,070 | $300,900 | $66,300 | $234,600 |
| 2019 | $3,990 | $201,646 | $27,470 | $174,176 |
| 2018 | $3,931 | $197,693 | $26,932 | $170,761 |
| 2017 | $3,832 | $193,817 | $26,404 | $167,413 |
| 2016 | $3,772 | $190,018 | $25,887 | $164,131 |
| 2015 | $3,706 | $187,165 | $25,499 | $161,666 |
| 2014 | $3,439 | $171,635 | $21,059 | $150,576 |
Source: Public Records
Map
Nearby Homes
- 1529 Garnet Way
- 1471 Garnet Way
- 1440 Claridge Ct
- 1514 Crowder Way
- 1417 Minories Dr
- 1822 Chelsea Ct
- Plan 2622 Modeled at Cobblestone - Butte Vista
- Plan 2321 Modeled at Cobblestone - Butte Vista
- 1551 Minories Dr
- 1746 Fleda Ave
- 1746 Fleet Ct
- 1670 Guildford Way
- 1666 Guildford Way
- 1182 Camomile Dr
- 1188 Camomile Dr
- 1164 Camomile Dr
- 1158 Camomile Dr
- 1138 Camomile Dr
- 1132 Camomile Dr
- 1114 Camomile Dr
- 1512 Garnet Way
- 1506 Garnet Way
- 1518 Garnet Way
- 1500 Garnet Way
- 1524 Garnet Way
- 1511 Minories Dr
- 1511 Garnet Way
- 1530 Garnet Way
- 1517 Garnet Way
- 1494 Garnet Way
- 1505 Garnet Way
- 1523 Minories Dr
- 1523 Garnet Way
- 1499 Garnet Way
- 1536 Garnet Way
- 1490 Garnet Way
- 1493 Garnet Way
- 1535 Minories Dr
- 1535 Garnet Way
- 1486 Garnet Way