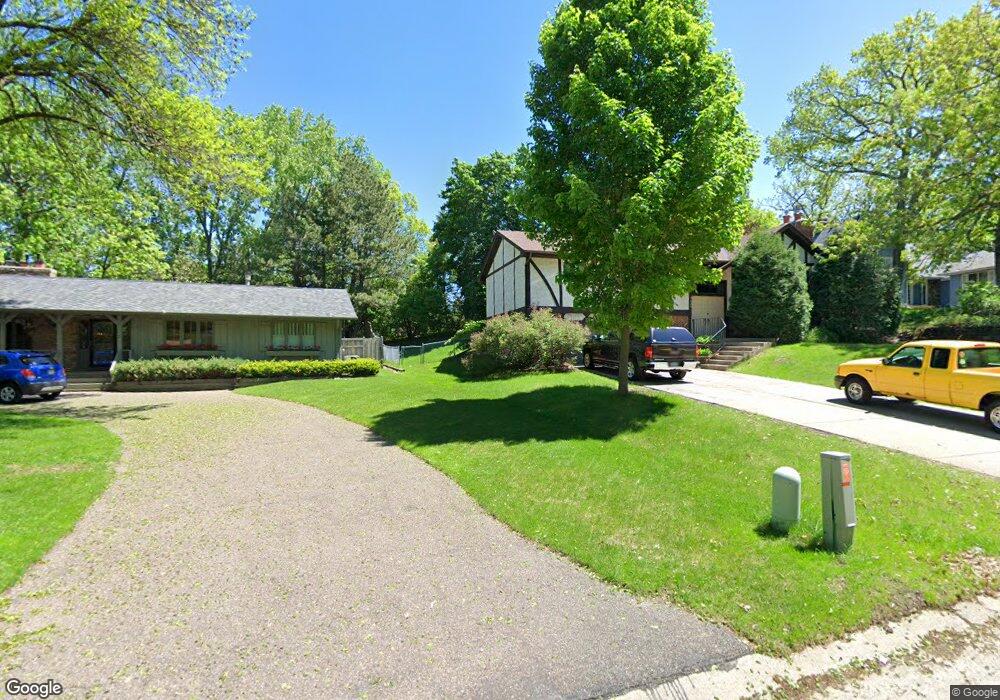
1512 Trapp Ct Minneapolis, MN 55432
Black Forest NeighborhoodEstimated Value: $240,000 - $244,000
2
Beds
2
Baths
1,596
Sq Ft
$151/Sq Ft
Est. Value
About This Home
This home is located at 1512 Trapp Ct, Minneapolis, MN 55432 and is currently estimated at $241,368, approximately $151 per square foot. 1512 Trapp Ct is a home located in Anoka County with nearby schools including Al-Amal School and Totino-Grace High School.
Ownership History
Date
Name
Owned For
Owner Type
Purchase Details
Closed on
Jul 19, 2021
Sold by
Cruse Shane
Bought by
Yanez Christian Reynosa
Current Estimated Value
Home Financials for this Owner
Home Financials are based on the most recent Mortgage that was taken out on this home.
Original Mortgage
$204,670
Outstanding Balance
$185,791
Interest Rate
2.93%
Mortgage Type
Stand Alone Second
Estimated Equity
$55,577
Purchase Details
Closed on
Aug 31, 2006
Sold by
Kodada Mary A
Bought by
Cruse Shane
Home Financials for this Owner
Home Financials are based on the most recent Mortgage that was taken out on this home.
Original Mortgage
$127,500
Interest Rate
6.7%
Mortgage Type
New Conventional
Purchase Details
Closed on
Nov 19, 1999
Sold by
Douglas Daniel R and Douglas Melissa
Bought by
Kodada Mary A
Purchase Details
Closed on
May 14, 1996
Sold by
Kamel Magdy K
Bought by
Douglas Daniel R
Create a Home Valuation Report for This Property
The Home Valuation Report is an in-depth analysis detailing your home's value as well as a comparison with similar homes in the area
Home Values in the Area
Average Home Value in this Area
Purchase History
| Date | Buyer | Sale Price | Title Company |
|---|---|---|---|
| Yanez Christian Reynosa | $211,000 | Titlesmart Inc | |
| Cruse Shane | $167,500 | -- | |
| Kodada Mary A | $116,000 | -- | |
| Douglas Daniel R | $79,900 | -- | |
| Yanez Christian Christian | $211,000 | -- |
Source: Public Records
Mortgage History
| Date | Status | Borrower | Loan Amount |
|---|---|---|---|
| Open | Yanez Christian Reynosa | $204,670 | |
| Closed | Yanez Christian Reynosa | $204,670 | |
| Previous Owner | Cruse Shane | $127,500 | |
| Closed | Yanez Christian Christian | $204,670 |
Source: Public Records
Tax History Compared to Growth
Tax History
| Year | Tax Paid | Tax Assessment Tax Assessment Total Assessment is a certain percentage of the fair market value that is determined by local assessors to be the total taxable value of land and additions on the property. | Land | Improvement |
|---|---|---|---|---|
| 2025 | $2,468 | $212,100 | $35,900 | $176,200 |
| 2024 | $2,468 | $218,900 | $41,600 | $177,300 |
| 2023 | $1,938 | $217,600 | $41,600 | $176,000 |
| 2022 | $1,862 | $204,500 | $35,200 | $169,300 |
| 2021 | $1,888 | $175,700 | $24,700 | $151,000 |
| 2020 | $1,700 | $168,300 | $21,700 | $146,600 |
| 2019 | $1,626 | $156,500 | $24,300 | $132,200 |
| 2018 | $1,474 | $149,400 | $0 | $0 |
| 2017 | $1,405 | $129,600 | $0 | $0 |
| 2016 | $1,352 | $119,300 | $0 | $0 |
| 2015 | $1,209 | $119,300 | $17,600 | $101,700 |
| 2014 | -- | $100,800 | $7,900 | $92,900 |
Source: Public Records
Map
Nearby Homes
- 5611 W Bavarian Pass
- 5564 E Danube Rd
- 5546 Meister Rd
- 1543 W Bavarian Ct
- 1601 N Innsbruck Dr Unit 220
- 1601 N Innsbruck Dr Unit 319
- 1601 N Innsbruck Dr Unit 329
- 1601 N Innsbruck Dr Unit 123
- 1601 N Innsbruck Dr Unit 373
- 5516 E Bavarian Pass
- 5527 E Bavarian Pass
- 5503 E Bavarian Pass
- 1448 Windemere Dr NE
- 5895 Tennison Dr NE
- 1689 Stinson Blvd
- 5230 Lincoln St NE
- 1640 29th Ave NW
- 1039 Fillmore Cir NE
- 6064 Woody Ln NE
- 1267 Brighton Square
- 1514 Trapp Ct
- 1510 Trapp Ct
- 1516 Trapp Ct
- 5626 W Bavarian Pass
- 5620 W Bavarian Pass
- 1523 Trapp Ct
- 5629 N Danube Rd
- 5616 W Bavarian Pass
- 1525 Trapp Ct
- 1511 N Innsbruck Dr
- 5615 N Danube Rd
- 1517 N Innsbruck Dr
- 5643 N Danube Rd
- 5624 W Bavarian Pass
- 5610 W Bavarian Pass
- 5622 W Bavarian Pass
- 1515 Trapp Ct
- 1513 Trapp Ct
- 1521 Trapp Ct
- 5614 W Bavarian Pass