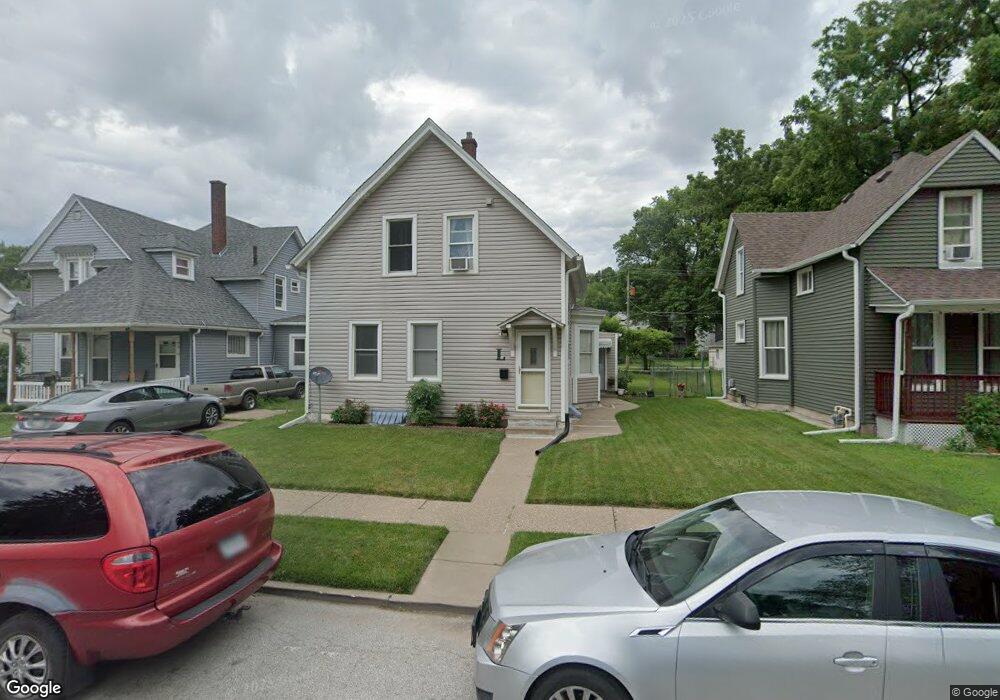
1512 W 7th St Davenport, IA 52802
Riverview Terrace NeighborhoodEstimated Value: $92,000 - $119,364
1
Bed
1
Bath
1,492
Sq Ft
$72/Sq Ft
Est. Value
About This Home
This home is located at 1512 W 7th St, Davenport, IA 52802 and is currently estimated at $107,341, approximately $71 per square foot. 1512 W 7th St is a home located in Scott County with nearby schools including Walnut Hill Elementary School, South Christian Elementary School, and Christian County Middle School.
Ownership History
Date
Name
Owned For
Owner Type
Purchase Details
Closed on
Aug 29, 2006
Sold by
Le Tom V and Le Phuonganh
Bought by
Lopez Enrique H and Lopez Graciela Vega
Current Estimated Value
Home Financials for this Owner
Home Financials are based on the most recent Mortgage that was taken out on this home.
Original Mortgage
$84,333
Outstanding Balance
$49,885
Interest Rate
6.49%
Mortgage Type
FHA
Estimated Equity
$57,456
Create a Home Valuation Report for This Property
The Home Valuation Report is an in-depth analysis detailing your home's value as well as a comparison with similar homes in the area
Home Values in the Area
Average Home Value in this Area
Purchase History
| Date | Buyer | Sale Price | Title Company |
|---|---|---|---|
| Lopez Enrique H | $85,000 | None Available |
Source: Public Records
Mortgage History
| Date | Status | Borrower | Loan Amount |
|---|---|---|---|
| Open | Lopez Enrique H | $84,333 |
Source: Public Records
Tax History Compared to Growth
Tax History
| Year | Tax Paid | Tax Assessment Tax Assessment Total Assessment is a certain percentage of the fair market value that is determined by local assessors to be the total taxable value of land and additions on the property. | Land | Improvement |
|---|---|---|---|---|
| 2025 | $1,428 | $100,600 | $11,250 | $89,350 |
| 2024 | $1,388 | $90,090 | $11,250 | $78,840 |
| 2023 | $1,250 | $90,090 | $11,250 | $78,840 |
| 2022 | $1,254 | $67,430 | $11,250 | $56,180 |
| 2021 | $1,254 | $67,430 | $11,250 | $56,180 |
| 2020 | $1,134 | $60,990 | $11,250 | $49,740 |
| 2019 | $1,178 | $60,990 | $11,250 | $49,740 |
| 2018 | $1,148 | $60,990 | $11,250 | $49,740 |
| 2017 | $1,194 | $60,990 | $11,250 | $49,740 |
| 2016 | $1,144 | $60,990 | $0 | $0 |
| 2015 | $1,144 | $63,930 | $0 | $0 |
| 2014 | $1,226 | $63,930 | $0 | $0 |
| 2013 | $1,200 | $0 | $0 | $0 |
| 2012 | -- | $60,990 | $7,310 | $53,680 |
Source: Public Records
Map
Nearby Homes