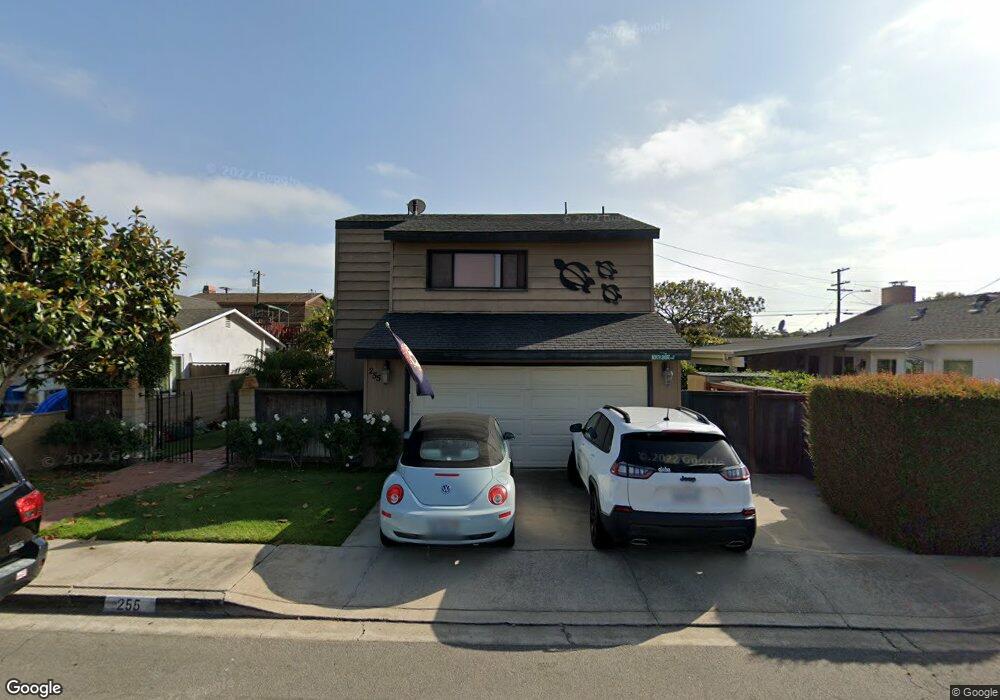
1512 Westminster Ave Costa Mesa, CA 92627
Downtown Costa Mesa NeighborhoodEstimated Value: $1,359,000 - $1,804,000
1
Bed
1
Bath
630
Sq Ft
$2,515/Sq Ft
Est. Value
About This Home
This home is located at 1512 Westminster Ave, Costa Mesa, CA 92627 and is currently estimated at $1,584,641, approximately $2,515 per square foot. 1512 Westminster Ave is a home located in Orange County with nearby schools including Newport Heights Elementary, Horace Ensign Intermediate School, and Newport Harbor High School.
Ownership History
Date
Name
Owned For
Owner Type
Purchase Details
Closed on
Dec 11, 2013
Sold by
Weinstock Stephen A and Weinstock Merrie A
Bought by
S & M Weinstock Trust
Current Estimated Value
Purchase Details
Closed on
Nov 13, 2000
Sold by
Busch Anneliese
Bought by
Weinstock Stephan A and Busch Weinstock Merrie A
Purchase Details
Closed on
Aug 28, 1995
Sold by
Vandeventer Wallace R and Vandeventer Bernice M
Bought by
Weinstock Stephan A and Busch Weinstock Merrie A
Home Financials for this Owner
Home Financials are based on the most recent Mortgage that was taken out on this home.
Original Mortgage
$179,800
Interest Rate
7.48%
Mortgage Type
Purchase Money Mortgage
Purchase Details
Closed on
Mar 10, 1994
Sold by
Vandeventer Wallace R and Vandeventer Bernice M
Bought by
Vandeventer Wallace R and Vandeventer Bernice M
Create a Home Valuation Report for This Property
The Home Valuation Report is an in-depth analysis detailing your home's value as well as a comparison with similar homes in the area
Home Values in the Area
Average Home Value in this Area
Purchase History
| Date | Buyer | Sale Price | Title Company |
|---|---|---|---|
| S & M Weinstock Trust | -- | None Available | |
| Weinstock Stephan A | -- | None Available | |
| Weinstock Stephan A | -- | -- | |
| Weinstock Stephan A | $200,000 | Commonwealth Land Title | |
| Vandeventer Wallace R | -- | -- |
Source: Public Records
Mortgage History
| Date | Status | Borrower | Loan Amount |
|---|---|---|---|
| Previous Owner | Weinstock Stephan A | $179,800 |
Source: Public Records
Tax History
| Year | Tax Paid | Tax Assessment Tax Assessment Total Assessment is a certain percentage of the fair market value that is determined by local assessors to be the total taxable value of land and additions on the property. | Land | Improvement |
|---|---|---|---|---|
| 2025 | $5,150 | $332,238 | $258,264 | $73,974 |
| 2024 | $5,150 | $325,724 | $253,200 | $72,524 |
| 2023 | $4,892 | $319,338 | $248,236 | $71,102 |
| 2022 | $4,600 | $313,077 | $243,369 | $69,708 |
| 2021 | $4,354 | $306,939 | $238,597 | $68,342 |
| 2020 | $4,284 | $303,792 | $236,150 | $67,642 |
| 2019 | $4,185 | $297,836 | $231,520 | $66,316 |
| 2018 | $4,099 | $291,997 | $226,981 | $65,016 |
| 2017 | $4,038 | $286,272 | $222,530 | $63,742 |
| 2016 | $3,962 | $280,659 | $218,166 | $62,493 |
| 2015 | $3,925 | $276,444 | $214,889 | $61,555 |
| 2014 | $3,845 | $271,029 | $210,679 | $60,350 |
Source: Public Records
Map
Nearby Homes
- 521 Westminster Ave
- 3209 Clay St
- 1586 Orange Ave
- 1581 Orange Ave Unit B
- 143 Mercer Way
- 1532 Maxwell Way
- 539 Tustin Ave
- 401 Holmwood Dr
- 337 Holmwood Dr
- 766 Tustin Ave Unit 5
- 425 Tustin Ave
- 300 Holmwood Dr
- 1650 Topanga
- 1653 Topanga
- 600 Powell Place
- 405 El Modena Ave
- 1683 Superior Ave
- 230 Ocean View Ave
- 639 Channel Way
- 2953 Cliff Dr
- 1518 Westminster Ave
- 265 Palmer St
- 258 E 15th St
- 254 E 15th St Unit 2
- 254 E 15th St Unit 1
- 250 E 15th St
- 262 E 15th St
- 1519 Westminster Ave
- 1519 Westminster Ave
- 267 Palmer St
- 266 E 15th St
- 244 E 15th St
- 273 Palmer St
- 273 1/2 Palmer St
- 270 E 15th St
- 252 Palmer St
- 256 Palmer St
- 243 Palmer St
- 243 Palmer St
- 240 E 15th St
Your Personal Tour Guide
Ask me questions while you tour the home.