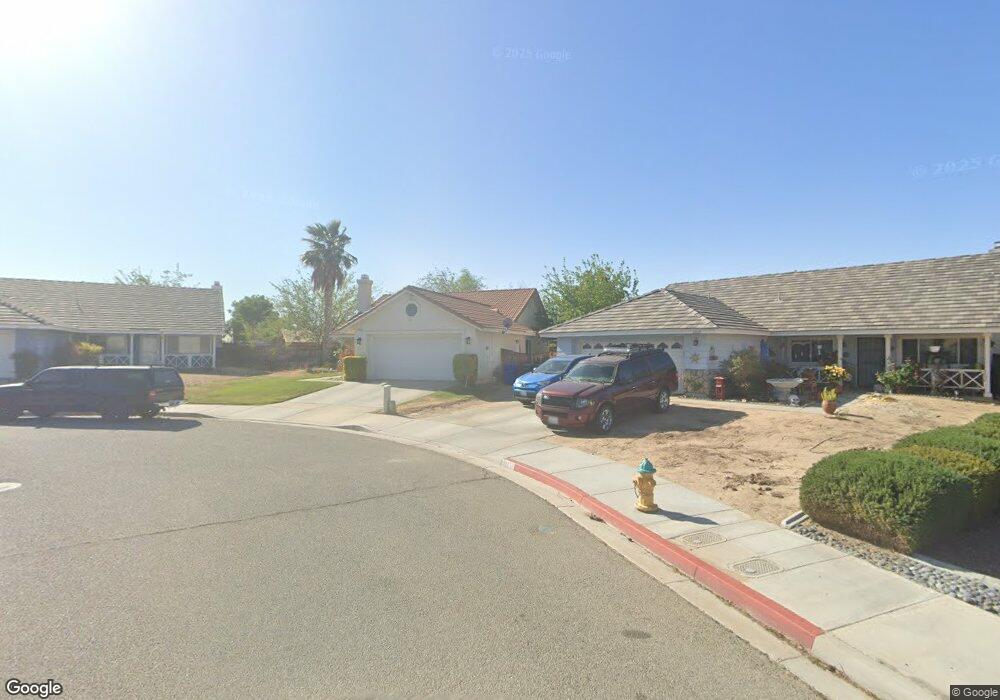
15123 Cactus Hollow Ct Victorville, CA 92394
Estimated Value: $390,000 - $480,000
3
Beds
2
Baths
1,692
Sq Ft
$249/Sq Ft
Est. Value
About This Home
This home is located at 15123 Cactus Hollow Ct, Victorville, CA 92394 and is currently estimated at $421,347, approximately $249 per square foot. 15123 Cactus Hollow Ct is a home located in San Bernardino County with nearby schools including Village Elementary School, Brentwood Elementary School, and Puesta Del Sol Elementary School.
Ownership History
Date
Name
Owned For
Owner Type
Purchase Details
Closed on
Jun 26, 2006
Sold by
Gurneal Alex
Bought by
Gurneal Alex and Gurneal Rebekah R
Current Estimated Value
Home Financials for this Owner
Home Financials are based on the most recent Mortgage that was taken out on this home.
Original Mortgage
$206,500
Outstanding Balance
$122,459
Interest Rate
6.63%
Mortgage Type
New Conventional
Estimated Equity
$298,888
Purchase Details
Closed on
May 20, 2004
Sold by
Gurneal Alex
Bought by
Gurneal Alexander and Gurneal Rebekah
Purchase Details
Closed on
Nov 14, 2000
Sold by
Valenciano Miguel A
Bought by
Gurneal Alex and Gurneal Rebekah R
Home Financials for this Owner
Home Financials are based on the most recent Mortgage that was taken out on this home.
Original Mortgage
$89,362
Interest Rate
7.86%
Mortgage Type
FHA
Create a Home Valuation Report for This Property
The Home Valuation Report is an in-depth analysis detailing your home's value as well as a comparison with similar homes in the area
Home Values in the Area
Average Home Value in this Area
Purchase History
| Date | Buyer | Sale Price | Title Company |
|---|---|---|---|
| Gurneal Alex | -- | Accommodation | |
| Gurneal Alex | -- | United Title Company | |
| Gurneal Alexander | -- | New Century Title Company | |
| Gurneal Alex | $89,500 | United Title |
Source: Public Records
Mortgage History
| Date | Status | Borrower | Loan Amount |
|---|---|---|---|
| Open | Gurneal Alex | $206,500 | |
| Closed | Gurneal Alex | $89,362 |
Source: Public Records
Tax History Compared to Growth
Tax History
| Year | Tax Paid | Tax Assessment Tax Assessment Total Assessment is a certain percentage of the fair market value that is determined by local assessors to be the total taxable value of land and additions on the property. | Land | Improvement |
|---|---|---|---|---|
| 2025 | $1,873 | $159,251 | $22,929 | $136,322 |
| 2024 | $1,873 | $156,128 | $22,479 | $133,649 |
| 2023 | $1,854 | $153,066 | $22,038 | $131,028 |
| 2022 | $1,822 | $150,065 | $21,606 | $128,459 |
| 2021 | $1,817 | $147,122 | $21,182 | $125,940 |
| 2020 | $1,785 | $145,614 | $20,965 | $124,649 |
| 2019 | $1,756 | $142,759 | $20,554 | $122,205 |
| 2018 | $1,870 | $139,960 | $20,151 | $119,809 |
| 2017 | $1,832 | $137,216 | $19,756 | $117,460 |
| 2016 | $1,796 | $134,526 | $19,369 | $115,157 |
| 2015 | $1,734 | $132,505 | $19,078 | $113,427 |
| 2014 | $1,701 | $129,909 | $18,704 | $111,205 |
Source: Public Records
Map
Nearby Homes
- 15095 Laurelwood Place
- 15197 Mesquite Place
- 15541 Bow String St
- 15163 Mesquite Ave
- 15619 Ferndale Rd
- 15591 Amber Pointe Dr
- 15588 Chaparral St
- 15376 San Miguel Way
- 15171 San Jose Dr
- 15711 Garnet Cove
- 15056 Tawney Ridge Ln
- 15132 Jeraldo Dr
- 14747 Saguaro St
- 15637 Topango Rd
- 15250 Garnet Cove
- 15227 Flagstaff St
- 15175 Dakota Way
- 15056 Dakota St
- 15413 Burwood Rd
- 15638 Burwood Rd
- 15117 Cactus Hollow Ct
- 15400 Mesquite Ave
- 15127 Cactus Hollow Ct
- 15394 Mesquite Ave
- 15412 Mesquite Ave
- 15111 Cactus Hollow Ct
- 15384 Mesquite Ave
- 15418 Mesquite Ave
- 15128 Cactus Hollow Ct
- 15103 Cactus Hollow Ct
- 15124 Cactus Hollow Ct
- 15449 Amber Pointe Dr
- 15372 Mesquite Ave
- 15426 Mesquite Ave
- 15409 Jeraldo Dr
- 15160 Mesquite Ct
- 15419 Jeraldo Dr
- 15181 Mesquite Cir
- 15453 Amber Pointe Dr