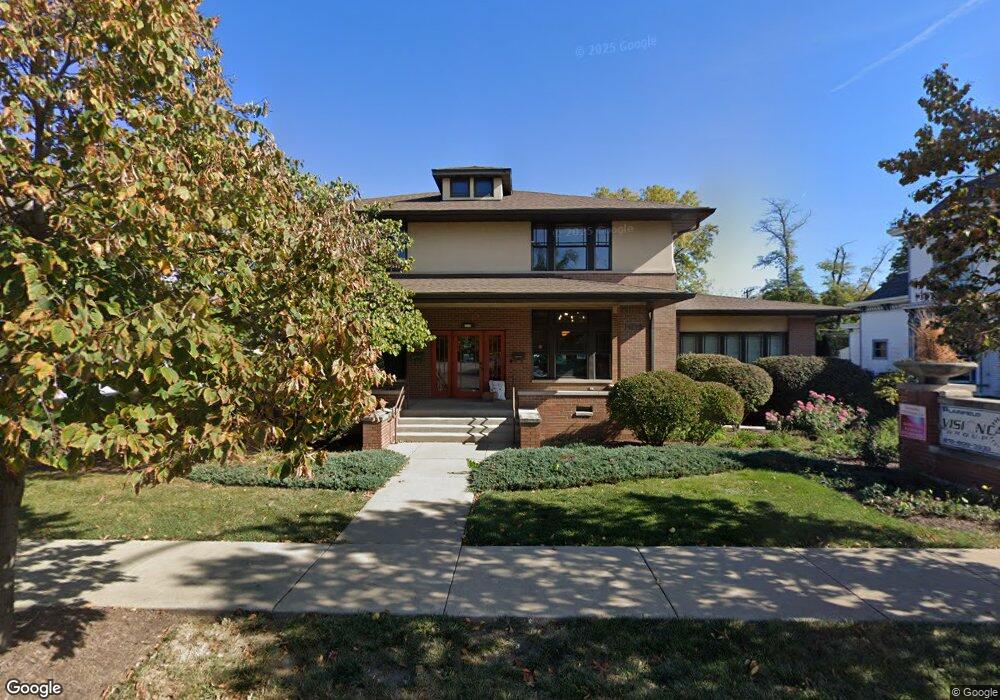
15129 S Route 59 Unit A Plainfield, IL 60544
East Plainfield NeighborhoodEstimated Value: $1,299,383
--
Bed
--
Bath
--
Sq Ft
0.28
Acres
About This Home
This home is located at 15129 S Route 59 Unit A, Plainfield, IL 60544 and is currently estimated at $1,299,383. 15129 S Route 59 Unit A is a home located in Will County with nearby schools including Central Elementary School, Indian Trail Middle School, and Plainfield Central High School.
Ownership History
Date
Name
Owned For
Owner Type
Purchase Details
Closed on
May 7, 2014
Sold by
Infutor Holdings Llc
Bought by
Vision Care Group Holdings Llc
Current Estimated Value
Home Financials for this Owner
Home Financials are based on the most recent Mortgage that was taken out on this home.
Original Mortgage
$337,500
Outstanding Balance
$265,766
Interest Rate
5.25%
Mortgage Type
Commercial
Estimated Equity
$1,033,617
Purchase Details
Closed on
Aug 14, 2009
Sold by
Plainfield Properties Llc
Bought by
Infutor Holdings Llc
Home Financials for this Owner
Home Financials are based on the most recent Mortgage that was taken out on this home.
Original Mortgage
$515,000
Interest Rate
5.85%
Mortgage Type
Commercial
Purchase Details
Closed on
Apr 1, 2002
Sold by
Olsen Clayton and Olsen Debra
Bought by
Plainfield Properties Llc
Create a Home Valuation Report for This Property
The Home Valuation Report is an in-depth analysis detailing your home's value as well as a comparison with similar homes in the area
Home Values in the Area
Average Home Value in this Area
Purchase History
| Date | Buyer | Sale Price | Title Company |
|---|---|---|---|
| Vision Care Group Holdings Llc | $650,000 | First American Title | |
| Infutor Holdings Llc | $690,000 | Chicago Title Insurance Co | |
| Plainfield Properties Llc | -- | -- |
Source: Public Records
Mortgage History
| Date | Status | Borrower | Loan Amount |
|---|---|---|---|
| Open | Vision Care Group Holdings Llc | $337,500 | |
| Previous Owner | Infutor Holdings Llc | $515,000 |
Source: Public Records
Tax History Compared to Growth
Tax History
| Year | Tax Paid | Tax Assessment Tax Assessment Total Assessment is a certain percentage of the fair market value that is determined by local assessors to be the total taxable value of land and additions on the property. | Land | Improvement |
|---|---|---|---|---|
| 2024 | $12,839 | $174,146 | $23,658 | $150,488 |
| 2023 | $12,839 | $174,146 | $23,658 | $150,488 |
| 2022 | $12,240 | $150,783 | $23,658 | $127,125 |
| 2021 | $12,414 | $150,783 | $23,658 | $127,125 |
| 2020 | $12,614 | $150,783 | $23,658 | $127,125 |
| 2019 | $12,807 | $150,783 | $23,658 | $127,125 |
| 2018 | $13,071 | $150,783 | $23,658 | $127,125 |
| 2017 | $13,371 | $150,783 | $23,658 | $127,125 |
| 2016 | $12,999 | $142,908 | $23,658 | $119,250 |
| 2015 | $11,216 | $149,658 | $23,658 | $126,000 |
| 2014 | $11,216 | $117,037 | $23,658 | $93,379 |
| 2013 | $11,216 | $117,037 | $23,658 | $93,379 |
Source: Public Records
Map
Nearby Homes
- 24003 W Commercial St
- 25446 W Emory Ln
- 25448 W Emory Ln
- 23909 W Main St
- 23627 W Chicago St
- 14814 S Penn Rd
- 14946 S Darr Dr
- 14954 S Darr Dr
- 14942 S Darr Dr
- 14932 S Henebry Ln
- 000 Wood Farm Rd
- 3.37AC Lockport St
- 15707 S Route 59
- 23700 W Getson Ave
- 23815 W Getson Ave
- 25500 W Alabaster Cir
- 14853 S Henebry Ln
- 14864 S Henebry Ln
- 14848 S Henebry Ln
- 14809 S Henebry Ln
- 15123 S Route 59
- 15133 S Route 59
- 15117 S Route 59
- 23929 W Chicago St
- 15128 S Dillman St
- 15136 S Dillman St
- 23925 W Chicago St
- 15132 S Dillman St
- 15132 S Dillman St Unit 2
- 15132 S Dillman St Unit 1
- 15130 S Route 59 Unit 202
- 15130 S Route 59 Unit 201
- 15130 S Route 59 Unit 203
- 15130 S Route 59 Unit 204
- 15130 S Route 59 Unit 102
- 15130 S Route 59 Unit 100
- 15130 S Route 59
- 15201 S Route 59
- 15130 Illinois Route 59 Unit 1
- 15130 Illinois Route 59