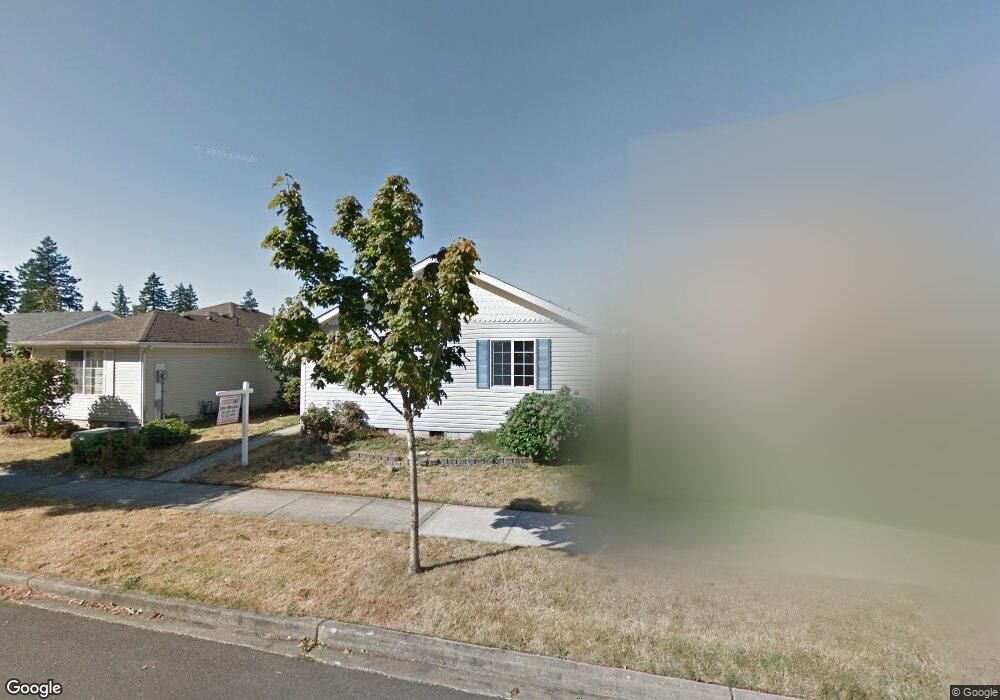
1513 Division St SW Olympia, WA 98502
South Westside NeighborhoodEstimated Value: $482,000 - $499,000
3
Beds
2
Baths
1,428
Sq Ft
$343/Sq Ft
Est. Value
About This Home
This home is located at 1513 Division St SW, Olympia, WA 98502 and is currently estimated at $489,924, approximately $343 per square foot. 1513 Division St SW is a home located in Thurston County with nearby schools including Julia Butler Hansen Elementary School, Thurgood Marshall Middle School, and Capital High School.
Ownership History
Date
Name
Owned For
Owner Type
Purchase Details
Closed on
Dec 19, 2011
Sold by
U S Bank Na
Bought by
Muller Michael T and Muller Joanne M
Current Estimated Value
Home Financials for this Owner
Home Financials are based on the most recent Mortgage that was taken out on this home.
Original Mortgage
$116,250
Outstanding Balance
$79,255
Interest Rate
3.94%
Mortgage Type
New Conventional
Estimated Equity
$410,669
Purchase Details
Closed on
Aug 10, 2011
Sold by
Quan Joseph and Quan Sylvia
Bought by
U S Bank Na
Purchase Details
Closed on
Sep 23, 2003
Sold by
Redman Jennifer A and Redman Cory A
Bought by
Quan Joseph and Quan Sylvia
Home Financials for this Owner
Home Financials are based on the most recent Mortgage that was taken out on this home.
Original Mortgage
$131,110
Interest Rate
7%
Mortgage Type
Stand Alone First
Purchase Details
Closed on
Nov 22, 2000
Sold by
Wind River Development Group Inc
Bought by
Redman Cory A and Redman Jennifer A
Home Financials for this Owner
Home Financials are based on the most recent Mortgage that was taken out on this home.
Original Mortgage
$137,764
Interest Rate
7.86%
Mortgage Type
FHA
Create a Home Valuation Report for This Property
The Home Valuation Report is an in-depth analysis detailing your home's value as well as a comparison with similar homes in the area
Home Values in the Area
Average Home Value in this Area
Purchase History
| Date | Buyer | Sale Price | Title Company |
|---|---|---|---|
| Muller Michael T | $155,000 | First American Title | |
| U S Bank Na | $138,795 | Northwest Title | |
| Quan Joseph | $163,890 | Transnation Title Insur | |
| Redman Cory A | $138,900 | Chicago Title Insurance Co |
Source: Public Records
Mortgage History
| Date | Status | Borrower | Loan Amount |
|---|---|---|---|
| Open | Muller Michael T | $116,250 | |
| Previous Owner | Quan Joseph | $131,110 | |
| Previous Owner | Redman Cory A | $137,764 |
Source: Public Records
Tax History Compared to Growth
Tax History
| Year | Tax Paid | Tax Assessment Tax Assessment Total Assessment is a certain percentage of the fair market value that is determined by local assessors to be the total taxable value of land and additions on the property. | Land | Improvement |
|---|---|---|---|---|
| 2024 | $4,344 | $430,700 | $145,600 | $285,100 |
| 2023 | $4,344 | $415,200 | $114,800 | $300,400 |
| 2022 | $4,255 | $416,200 | $91,500 | $324,700 |
| 2021 | $3,615 | $356,000 | $82,600 | $273,400 |
| 2020 | $3,693 | $279,800 | $67,400 | $212,400 |
| 2019 | $3,310 | $278,900 | $62,000 | $216,900 |
| 2018 | $3,275 | $243,100 | $53,100 | $190,000 |
| 2017 | $2,805 | $224,300 | $60,900 | $163,400 |
| 2016 | $2,427 | $205,150 | $56,250 | $148,900 |
| 2014 | -- | $193,850 | $55,150 | $138,700 |
Source: Public Records
Map
Nearby Homes
- 2004 15th Ave SW
- 1405 Fern St SW
- 1709 Fern St SW
- 1516 Decatur St SW Unit 210
- 933 Fern St SW Unit 933
- 1801 Evergreen Park Ct SW Unit 10
- 1407 Evergreen Park Dr SW Unit 301
- 2300 9th Ave SW Unit A5
- 922 Plymouth St SW
- 821 Thomas St SW
- 4937 Black Lake Blvd SW
- 1910 Evergreen Park Dr SW Unit 905
- 113 Decatur St NW
- 1111 Archwood Dr SW Unit 196
- 1111 Archwood Dr SW Unit 361
- 1111 Archwood Dr SW Unit 324
- 2609 Firland St SW
- 101 Rogers St NW
- 1111 Archwood Dr SW Unit 375
- 1111 Archwood Dr SW Unit 345
- 1509 Division St SW
- 1517 Division St SW
- 1505 Division St SW
- 1521 Division St SW
- 1525 Division St SW
- 1514 Division St SW
- 1510 Division St SW
- 1518 Division St SW
- 1506 Division St SW
- 1529 Division St SW
- 1522 Division St SW
- 1502 Division St SW
- 1601 Division St SW
- 1530 Division St SW
- 1520 Fern St SW
- 1524 Fern St SW
- 1516 Fern St SW
- 1605 Division St SW
- 1507 Cushing St SW
- 1507 Cushing St SW