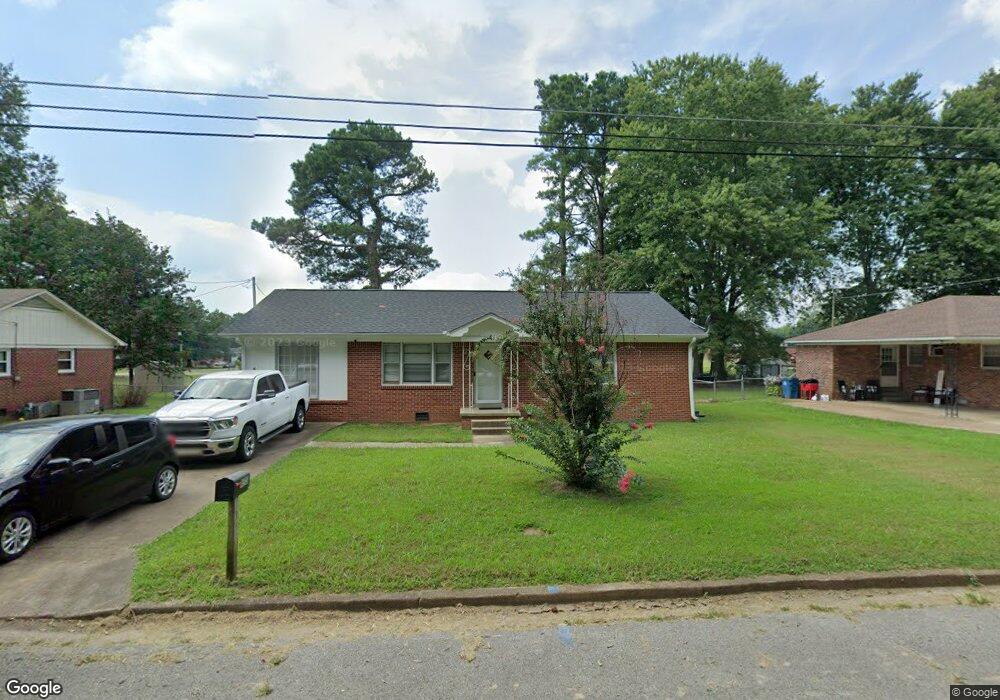
1513 Eastview Dr Humboldt, TN 38343
Estimated Value: $120,000 - $189,000
--
Bed
2
Baths
2,025
Sq Ft
$76/Sq Ft
Est. Value
About This Home
This home is located at 1513 Eastview Dr, Humboldt, TN 38343 and is currently estimated at $154,823, approximately $76 per square foot. 1513 Eastview Dr is a home located in Gibson County with nearby schools including Stigall Primary School, East Elementary School, and Humboldt Middle School.
Ownership History
Date
Name
Owned For
Owner Type
Purchase Details
Closed on
Jun 19, 2009
Sold by
Hsbc Mortgage Services Inc
Bought by
Lbs Investments Llc
Current Estimated Value
Home Financials for this Owner
Home Financials are based on the most recent Mortgage that was taken out on this home.
Original Mortgage
$45,040
Outstanding Balance
$28,365
Interest Rate
4.79%
Estimated Equity
$126,458
Purchase Details
Closed on
Aug 29, 2008
Sold by
Wyatt Shirley
Bought by
Hsbc Mortgage Services Inc
Purchase Details
Closed on
Jun 30, 2005
Sold by
Edwards Thomas R
Bought by
Wyatt Shirley
Home Financials for this Owner
Home Financials are based on the most recent Mortgage that was taken out on this home.
Original Mortgage
$62,910
Interest Rate
5.54%
Purchase Details
Closed on
Aug 18, 1965
Bought by
Edwards Thomas R and Cherry Ann
Create a Home Valuation Report for This Property
The Home Valuation Report is an in-depth analysis detailing your home's value as well as a comparison with similar homes in the area
Home Values in the Area
Average Home Value in this Area
Purchase History
| Date | Buyer | Sale Price | Title Company |
|---|---|---|---|
| Lbs Investments Llc | $43,000 | -- | |
| Hsbc Mortgage Services Inc | $68,594 | -- | |
| Wyatt Shirley | $69,900 | -- | |
| Edwards Thomas R | -- | -- |
Source: Public Records
Mortgage History
| Date | Status | Borrower | Loan Amount |
|---|---|---|---|
| Open | Edwards Thomas R | $45,040 | |
| Previous Owner | Edwards Thomas R | $62,910 |
Source: Public Records
Tax History Compared to Growth
Tax History
| Year | Tax Paid | Tax Assessment Tax Assessment Total Assessment is a certain percentage of the fair market value that is determined by local assessors to be the total taxable value of land and additions on the property. | Land | Improvement |
|---|---|---|---|---|
| 2025 | $809 | $29,850 | $0 | $0 |
| 2024 | $809 | $29,850 | $5,000 | $24,850 |
| 2023 | $207 | $18,800 | $3,000 | $15,800 |
| 2022 | $194 | $18,800 | $3,000 | $15,800 |
| 2021 | $194 | $18,800 | $3,000 | $15,800 |
| 2020 | $707 | $18,800 | $3,000 | $15,800 |
| 2019 | $707 | $18,800 | $3,000 | $15,800 |
| 2018 | $611 | $15,050 | $3,000 | $12,050 |
| 2017 | $604 | $15,050 | $3,000 | $12,050 |
| 2016 | $604 | $15,050 | $3,000 | $12,050 |
| 2015 | $598 | $15,050 | $3,000 | $12,050 |
| 2014 | -- | $15,050 | $3,000 | $12,050 |
Source: Public Records
Map
Nearby Homes
- 1320 Eastview Dr
- 1549 Eastview Dr
- 3115 Redwood St
- 0 Eastend Dr
- 3117 Laurel St
- 1211 N 29th Ave
- 1110 Woodgate Dr
- 1012 Parkway Cove
- 1338 Dungan St
- 00000 Lot 7 Mullins St
- 0000 lot 6-C Mullins St
- 000Lot 6-B Mullins St
- 00-lot 6-A Mullins St
- 700 N 29th Ave
- 2310 Dodson St
- 2900 E Mitchell St
- 2508 Vine St
- 804 N 24th Ave
- 2425 St Mary Dr
- 811 N 24th Ave
- 1517 Eastview Dr
- 1505 Eastview Dr
- 1521 Eastview Dr
- 1512 Eastview Dr
- 1503 Eastview Dr
- 1516 Eastview Dr
- 1508 Eastview Dr
- 1520 Eastview Dr
- 1504 Eastview Dr
- 1523 Eastview Dr
- 000 Eastview Dr
- 0 Eastview Dr
- 1513 Woodhaven St
- 1522 Eastview Dr
- 1515 Woodhaven St
- 1509 Woodhaven St
- 1413 Eastview Dr
- 1521 Woodhaven St
- 1525 Eastview Dr
- 1505 Woodhaven St