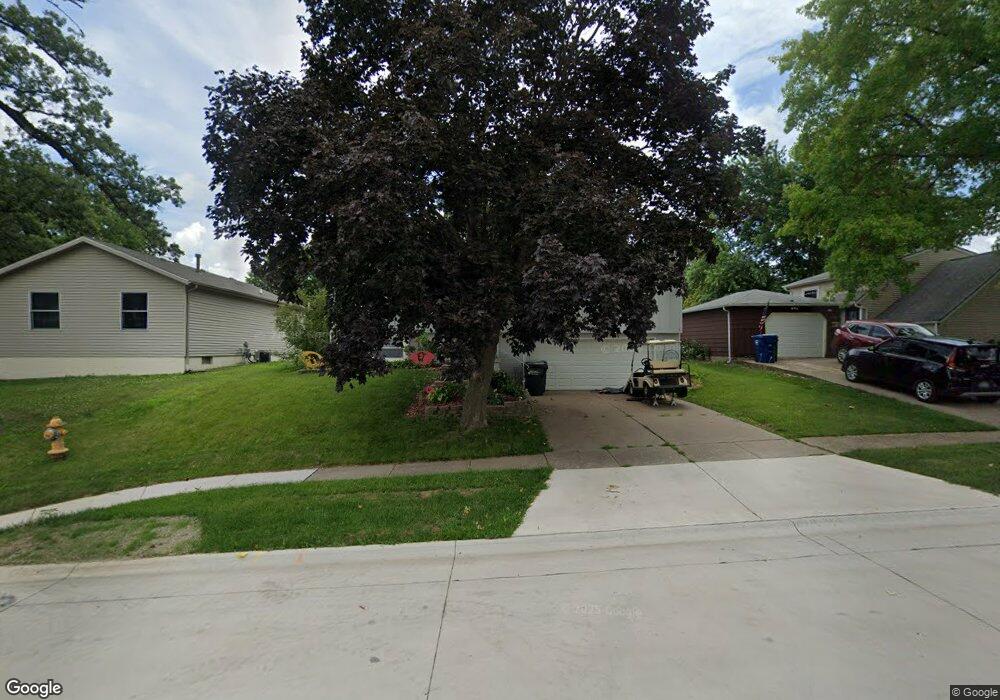
1513 Emerald Dr Davenport, IA 52804
Northwest Davenport NeighborhoodEstimated Value: $154,779 - $181,000
3
Beds
2
Baths
1,002
Sq Ft
$165/Sq Ft
Est. Value
About This Home
This home is located at 1513 Emerald Dr, Davenport, IA 52804 and is currently estimated at $164,945, approximately $164 per square foot. 1513 Emerald Dr is a home located in Scott County with nearby schools including Walnut Hill Elementary School, South Christian Elementary School, and Frank L. Smart Intermediate School.
Ownership History
Date
Name
Owned For
Owner Type
Purchase Details
Closed on
Jul 22, 2013
Sold by
Frantz Richard K and Frantz Roberta M
Bought by
Rbf Enterprises Llc
Current Estimated Value
Purchase Details
Closed on
Feb 3, 2012
Sold by
Frantz Richard K and Frantz Roberta M
Bought by
Rbf Enterprises Llc
Purchase Details
Closed on
May 12, 2011
Sold by
The Secretary Of Housing & Urban Develop
Bought by
Frantz Richard and Frantz Roberta
Purchase Details
Closed on
Aug 31, 2010
Sold by
Secretary Of Housing & Urban Development
Bought by
Citimortgage Inc
Purchase Details
Closed on
Nov 10, 2009
Sold by
Citimortgage Inc
Bought by
Secretary Of Housing & Urban Development
Purchase Details
Closed on
Mar 19, 2008
Sold by
Martens Nathan and Martens Nathan C
Bought by
Abn Amro Mortgage Group Inc
Purchase Details
Closed on
Nov 17, 2006
Sold by
Martens Robyn G
Bought by
Martens Nathan
Create a Home Valuation Report for This Property
The Home Valuation Report is an in-depth analysis detailing your home's value as well as a comparison with similar homes in the area
Home Values in the Area
Average Home Value in this Area
Purchase History
| Date | Buyer | Sale Price | Title Company |
|---|---|---|---|
| Rbf Enterprises Llc | -- | None Available | |
| Rbf Enterprises Llc | -- | None Available | |
| Frantz Richard | -- | None Available | |
| Citimortgage Inc | -- | None Available | |
| Secretary Of Housing & Urban Development | -- | None Available | |
| Abn Amro Mortgage Group Inc | $100,131 | None Available | |
| Martens Nathan | -- | None Available |
Source: Public Records
Tax History Compared to Growth
Tax History
| Year | Tax Paid | Tax Assessment Tax Assessment Total Assessment is a certain percentage of the fair market value that is determined by local assessors to be the total taxable value of land and additions on the property. | Land | Improvement |
|---|---|---|---|---|
| 2025 | $3,280 | $158,070 | $25,370 | $132,700 |
| 2024 | $3,152 | $154,620 | $25,370 | $129,250 |
| 2023 | $2,998 | $154,620 | $25,370 | $129,250 |
| 2022 | $2,868 | $130,430 | $21,570 | $108,860 |
| 2021 | $2,670 | $124,440 | $21,570 | $102,870 |
| 2020 | $2,552 | $117,450 | $21,570 | $95,880 |
| 2019 | $2,886 | $111,460 | $21,570 | $89,890 |
| 2018 | $1,126 | $111,460 | $21,570 | $89,890 |
| 2017 | $620 | $111,460 | $21,570 | $89,890 |
| 2016 | $2,692 | $106,460 | $0 | $0 |
| 2015 | $2,332 | $104,720 | $0 | $0 |
| 2014 | $2,326 | $104,720 | $0 | $0 |
| 2013 | $2,286 | $0 | $0 | $0 |
| 2012 | -- | $106,720 | $22,650 | $84,070 |
Source: Public Records
Map
Nearby Homes
- 1312 Emerald Dr
- 1310 Calvin St
- 1215 Calvin St
- 1139 Calvin St
- 4703 W 13th St
- 2025 Emerald Dr
- 1210 Eagle's Crest Dr
- 3920 W 13th St
- 2218 Emerald Dr
- 4836 W Pleasant St
- 2230 Emerald Dr
- 0 W Locust St Unit Utah
- 0 W Locust St Unit 23235762
- 0 W Locust St Unit NOC6326699
- 1215 Waverly Rd
- 4738 W 11th St
- 5321 Friendship Dr Unit 5320
- 1925 N Michigan Ave
- lots 1-10 Hidden Valley Cir
- 3430 W Locust St
- 1507 Emerald Dr
- 1521 Emerald Dr
- 1512 N Pioneer St
- 1503 Emerald Dr
- 1508 N Pioneer St
- 1514 N Pioneer St
- 1503 Emerald Dr
- 1605 Emerald Dr
- 1502 N Pioneer St
- 1514 Emerald Dr
- 1602 N Pioneer St
- 1508 Emerald Dr
- 1518 Emerald Dr
- 1409 Emerald Dr
- 1504 Emerald Dr
- 1416 N Pioneer St
- 1524 Emerald Dr
- 1610 N Pioneer St
- 1403 Emerald Dr
- 1408 Emerald Dr