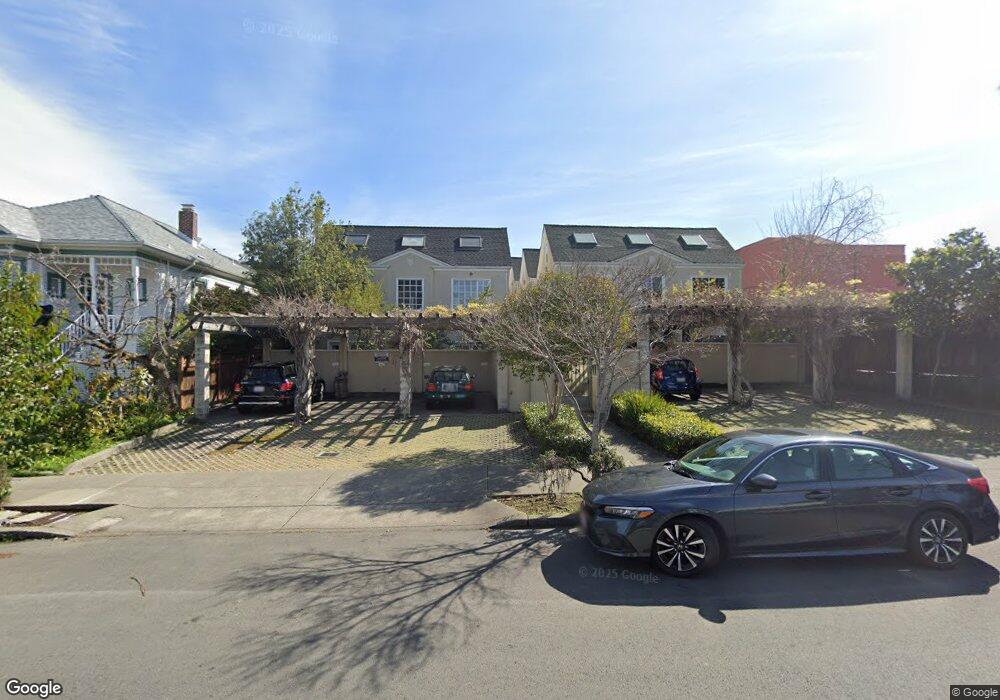
1513 Henry St Unit C Berkeley, CA 94709
North Berkeley NeighborhoodEstimated Value: $822,000 - $968,277
2
Beds
2
Baths
--
Sq Ft
5,227
Sq Ft Lot
About This Home
This home is located at 1513 Henry St Unit C, Berkeley, CA 94709 and is currently estimated at $879,819. 1513 Henry St Unit C is a home located in Alameda County with nearby schools including Berkeley Arts Magnet at Whittier School, Washington Elementary School, and Cragmont Elementary School.
Ownership History
Date
Name
Owned For
Owner Type
Purchase Details
Closed on
Oct 31, 2017
Sold by
Mathew Paul Alencheril
Bought by
Mathew Paul Alencheril and The Paul Mathew Living Trust
Current Estimated Value
Purchase Details
Closed on
Aug 25, 2010
Sold by
Rao Harish S and Rao Meera
Bought by
Mathew Paul A
Home Financials for this Owner
Home Financials are based on the most recent Mortgage that was taken out on this home.
Original Mortgage
$504,000
Outstanding Balance
$331,792
Interest Rate
4.38%
Mortgage Type
New Conventional
Estimated Equity
$548,027
Purchase Details
Closed on
May 29, 1997
Sold by
Hu Sheng Cheng and Hu Min Huey
Bought by
Rao Harish S and Rao Meera
Purchase Details
Closed on
Mar 27, 1996
Sold by
Holland Clarke B
Bought by
Hanken Hu Dianna and Hu Michael
Home Financials for this Owner
Home Financials are based on the most recent Mortgage that was taken out on this home.
Original Mortgage
$207,000
Interest Rate
6.98%
Create a Home Valuation Report for This Property
The Home Valuation Report is an in-depth analysis detailing your home's value as well as a comparison with similar homes in the area
Home Values in the Area
Average Home Value in this Area
Purchase History
| Date | Buyer | Sale Price | Title Company |
|---|---|---|---|
| Mathew Paul Alencheril | -- | None Available | |
| Mathew Paul A | $630,000 | Placer Title Company | |
| Rao Harish S | $313,500 | Placer Title Company | |
| Hanken Hu Dianna | $300,000 | Placer Title Company |
Source: Public Records
Mortgage History
| Date | Status | Borrower | Loan Amount |
|---|---|---|---|
| Open | Mathew Paul A | $504,000 | |
| Previous Owner | Hanken Hu Dianna | $207,000 |
Source: Public Records
Tax History
| Year | Tax Paid | Tax Assessment Tax Assessment Total Assessment is a certain percentage of the fair market value that is determined by local assessors to be the total taxable value of land and additions on the property. | Land | Improvement |
|---|---|---|---|---|
| 2025 | $12,669 | $800,092 | $242,127 | $564,965 |
| 2024 | $12,669 | $784,273 | $237,382 | $553,891 |
| 2023 | $12,401 | $775,762 | $232,728 | $543,034 |
| 2022 | $12,168 | $753,554 | $228,166 | $532,388 |
| 2021 | $12,191 | $738,641 | $223,692 | $521,949 |
| 2020 | $11,506 | $738,000 | $221,400 | $516,600 |
| 2019 | $11,021 | $723,535 | $217,060 | $506,475 |
| 2018 | $10,830 | $709,354 | $212,806 | $496,548 |
| 2017 | $10,457 | $695,450 | $208,635 | $486,815 |
| 2016 | $10,101 | $681,817 | $204,545 | $477,272 |
| 2015 | $9,963 | $671,580 | $201,474 | $470,106 |
| 2014 | $9,885 | $658,424 | $197,527 | $460,897 |
Source: Public Records
Map
Nearby Homes
- 1444 Walnut St
- 1440 Walnut St Unit 5
- 1610 Milvia St
- 1609 Bonita Ave Unit 3
- 1609 Bonita Ave Unit 5
- 1519 Oxford St Unit E
- 1425 Martin Luther King jr Way
- 1412 Oxford St
- 1682 Oxford St
- 1625 Martin Luther King jr Way
- 2201 Virginia St Unit 2
- 1815 Vine St
- 1808 Cedar St
- 2015 Delaware St
- 2015 Delaware St Unit A
- 1622 Scenic Ave
- 1471 Scenic Ave
- 2365 Virginia St Unit 2
- 2340 Virginia St
- 2121 Eunice St
- 1511 Henry St Unit B
- 1509 Henry St Unit A
- 1507 Henry St
- 1519 Henry St
- 1517 Henry St Unit B
- 1515 Henry St Unit A
- 2024 Vine St
- 2036 Vine St
- 2020 Vine St
- 1506 Henry St
- 1508 Henry St
- 1510 Henry St
- 1453 Henry St
- 1520 Henry St
- 2016 Vine St
- 2085 Vine St
- 1451 Henry St
- 1524 Henry St
- 2010 Vine St
- 1446 Henry St
Your Personal Tour Guide
Ask me questions while you tour the home.