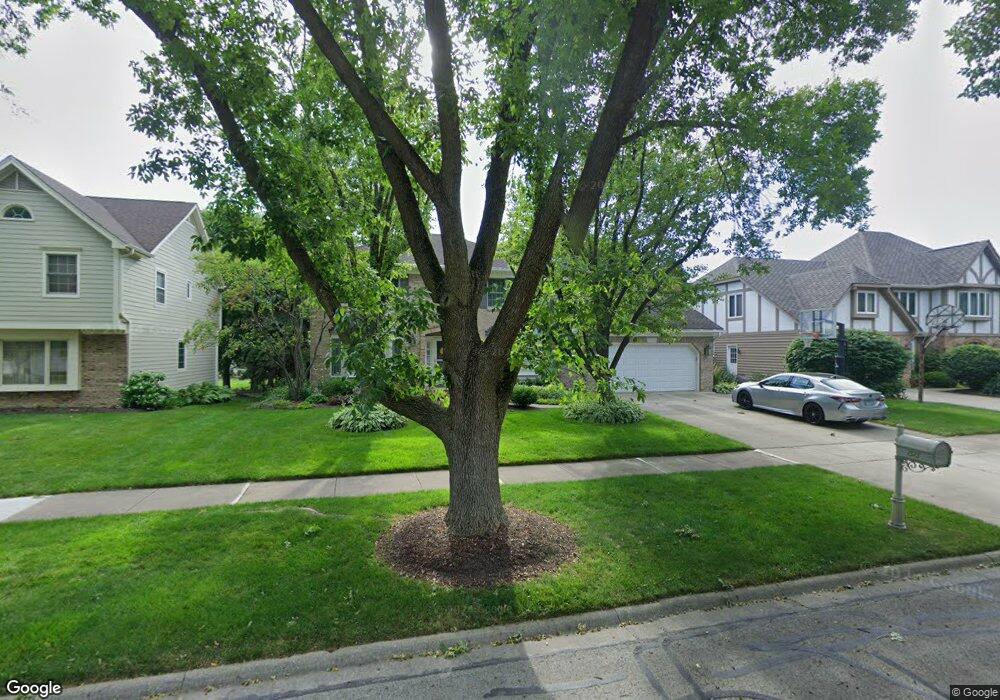
1513 Lantern Cir Naperville, IL 60540
Huntington Hill NeighborhoodEstimated Value: $759,000 - $868,000
--
Bed
1
Bath
3,110
Sq Ft
$262/Sq Ft
Est. Value
About This Home
This home is located at 1513 Lantern Cir, Naperville, IL 60540 and is currently estimated at $814,805, approximately $261 per square foot. 1513 Lantern Cir is a home located in DuPage County with nearby schools including Highlands Elementary School, Kennedy Junior High School, and Naperville North High School.
Ownership History
Date
Name
Owned For
Owner Type
Purchase Details
Closed on
Mar 9, 2010
Sold by
Popelka John and Popelka Loretta
Bought by
Popelka Loretta and Loretta Popelka Revocable Trust
Current Estimated Value
Purchase Details
Closed on
Mar 11, 1998
Sold by
American National Bk & Tr Co Of Chicago
Bought by
Popelka John M and Popelka Loretta C
Home Financials for this Owner
Home Financials are based on the most recent Mortgage that was taken out on this home.
Original Mortgage
$264,000
Outstanding Balance
$42,418
Interest Rate
5.62%
Estimated Equity
$772,387
Purchase Details
Closed on
Apr 2, 1997
Sold by
Cowan William H and Cowan Constance S
Bought by
American National Bk & Tr Co Of Chicago and Trust #500116-00
Home Financials for this Owner
Home Financials are based on the most recent Mortgage that was taken out on this home.
Original Mortgage
$264,000
Interest Rate
6.12%
Mortgage Type
Purchase Money Mortgage
Create a Home Valuation Report for This Property
The Home Valuation Report is an in-depth analysis detailing your home's value as well as a comparison with similar homes in the area
Home Values in the Area
Average Home Value in this Area
Purchase History
| Date | Buyer | Sale Price | Title Company |
|---|---|---|---|
| Popelka Loretta | -- | Chicago Title Insurance Co | |
| Popelka John M | -- | -- | |
| American National Bk & Tr Co Of Chicago | $330,000 | -- |
Source: Public Records
Mortgage History
| Date | Status | Borrower | Loan Amount |
|---|---|---|---|
| Open | Popelka John M | $264,000 | |
| Previous Owner | American National Bk & Tr Co Of Chicago | $264,000 |
Source: Public Records
Tax History Compared to Growth
Tax History
| Year | Tax Paid | Tax Assessment Tax Assessment Total Assessment is a certain percentage of the fair market value that is determined by local assessors to be the total taxable value of land and additions on the property. | Land | Improvement |
|---|---|---|---|---|
| 2024 | $13,914 | $235,126 | $76,239 | $158,887 |
| 2023 | $13,355 | $214,590 | $69,580 | $145,010 |
| 2022 | $12,462 | $199,620 | $64,730 | $134,890 |
| 2021 | $12,012 | $192,070 | $62,280 | $129,790 |
| 2020 | $11,700 | $186,730 | $61,160 | $125,570 |
| 2019 | $11,364 | $178,650 | $58,510 | $120,140 |
| 2018 | $11,367 | $178,650 | $58,510 | $120,140 |
| 2017 | $11,143 | $172,630 | $56,540 | $116,090 |
| 2016 | $11,349 | $172,620 | $56,540 | $116,080 |
| 2015 | $11,087 | $162,550 | $53,240 | $109,310 |
| 2014 | $11,215 | $159,370 | $52,200 | $107,170 |
| 2013 | $11,046 | $159,760 | $52,330 | $107,430 |
Source: Public Records
Map
Nearby Homes
- 1006 Bankfield Ct
- 1216 Tranquility Ct
- 2651 Yorkshire Ln
- 1105 Johnson Dr
- 1386 Old Dominion Ct
- 2647 Longview Dr
- 23W731 Hobson Rd
- 1519 77th St
- 1300 Old Dominion Rd
- 6142 Ivy Dr
- 6551 Shagbark Ct Unit 2
- 625 Edward Rd
- 907 Secretariat Dr
- 2783 Wayfaring Ln Unit 14B
- 1817 Appaloosa Dr
- 8S452 Bell Dr
- 7S610 Lynn Dr
- 2732 Weeping Willow Dr Unit B
- 923 Tim Tam Cir
- 32 Westmoreland Ln
- 1509 Lantern Cir
- 1517 Lantern Cir
- 1014 Revere Ct
- 1505 Lantern Cir
- 1018 Revere Ct
- 1521 Lantern Cir
- 1010 Revere Ct
- 1516 Lantern Cir
- 1022 Revere Ct
- 1006 Revere Ct
- 1512 Lantern Cir
- 1520 Lantern Cir
- 1501 Lantern Cir
- 1582 Culpepper Dr
- 1524 Lantern Cir
- 1508 Lantern Cir
- 1562 Culpepper Dr
- 1504 Lantern Cir
- 1026 Revere Ct
- 1483 Lantern Cir