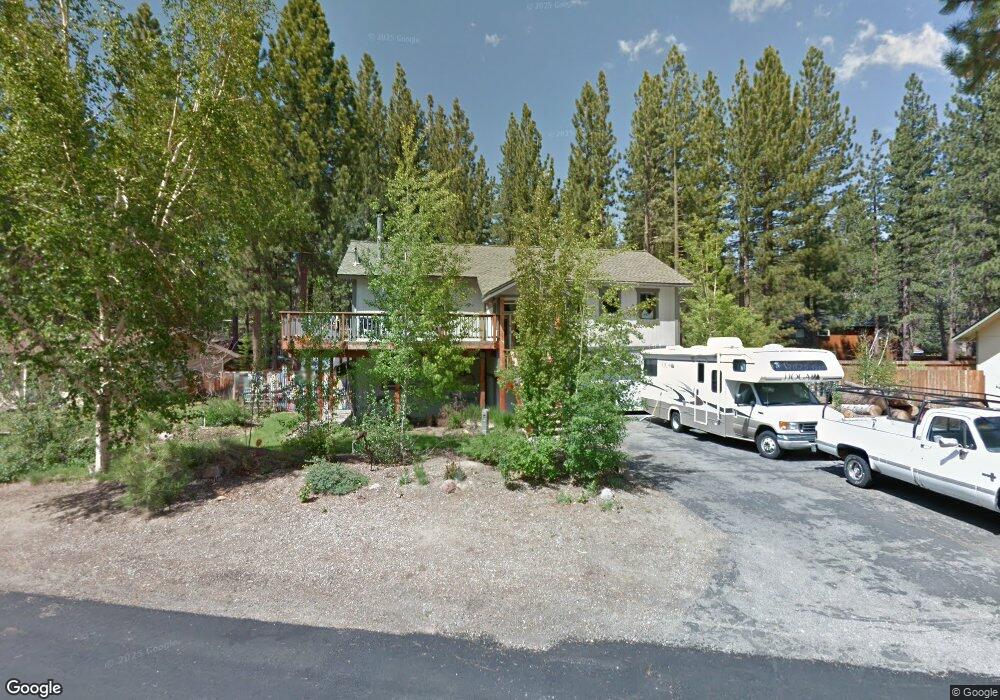
1513 Ormsby Dr South Lake Tahoe, CA 96150
Estimated Value: $694,000 - $854,000
3
Beds
3
Baths
1,930
Sq Ft
$392/Sq Ft
Est. Value
About This Home
This home is located at 1513 Ormsby Dr, South Lake Tahoe, CA 96150 and is currently estimated at $755,956, approximately $391 per square foot. 1513 Ormsby Dr is a home located in El Dorado County with nearby schools including Sierra House Elementary School, South Tahoe Middle School, and South Tahoe High School.
Ownership History
Date
Name
Owned For
Owner Type
Purchase Details
Closed on
Aug 15, 2025
Sold by
Scott Jennifer
Bought by
Jennifer Scott Revocable Trust and Scott
Current Estimated Value
Purchase Details
Closed on
Jun 9, 2014
Sold by
Scott Jennifer and Roberts Dale
Bought by
Scott Jennifer
Purchase Details
Closed on
Jan 9, 2001
Sold by
Swain Linda L
Bought by
Roberts Dale and Scott Jennifer
Home Financials for this Owner
Home Financials are based on the most recent Mortgage that was taken out on this home.
Original Mortgage
$231,200
Interest Rate
7.54%
Purchase Details
Closed on
Dec 23, 1998
Sold by
Cook Thomas Michael and Cook Patricia L
Bought by
Swain Linda L
Home Financials for this Owner
Home Financials are based on the most recent Mortgage that was taken out on this home.
Original Mortgage
$133,500
Interest Rate
6.66%
Create a Home Valuation Report for This Property
The Home Valuation Report is an in-depth analysis detailing your home's value as well as a comparison with similar homes in the area
Home Values in the Area
Average Home Value in this Area
Purchase History
| Date | Buyer | Sale Price | Title Company |
|---|---|---|---|
| Jennifer Scott Revocable Trust | -- | None Listed On Document | |
| Scott Jennifer | -- | None Available | |
| Roberts Dale | $289,000 | Fidelity National Title Co | |
| Swain Linda L | $178,000 | First American Title Ins Co |
Source: Public Records
Mortgage History
| Date | Status | Borrower | Loan Amount |
|---|---|---|---|
| Previous Owner | Roberts Dale | $231,200 | |
| Previous Owner | Swain Linda L | $133,500 | |
| Closed | Swain Linda L | $26,700 | |
| Closed | Roberts Dale | $43,350 |
Source: Public Records
Tax History Compared to Growth
Tax History
| Year | Tax Paid | Tax Assessment Tax Assessment Total Assessment is a certain percentage of the fair market value that is determined by local assessors to be the total taxable value of land and additions on the property. | Land | Improvement |
|---|---|---|---|---|
| 2025 | $4,683 | $446,824 | $67,794 | $379,030 |
| 2024 | $4,683 | $438,064 | $66,465 | $371,599 |
| 2023 | $4,601 | $429,475 | $65,162 | $364,313 |
| 2022 | $4,555 | $421,055 | $63,885 | $357,170 |
| 2021 | $4,480 | $412,800 | $62,633 | $350,167 |
| 2020 | $4,418 | $408,568 | $61,991 | $346,577 |
| 2019 | $4,395 | $400,558 | $60,776 | $339,782 |
| 2018 | $4,297 | $392,705 | $59,585 | $333,120 |
| 2017 | $4,228 | $385,006 | $58,417 | $326,589 |
| 2016 | $4,141 | $377,458 | $57,272 | $320,186 |
| 2015 | $3,828 | $371,790 | $56,412 | $315,378 |
| 2014 | $3,828 | $355,000 | $54,000 | $301,000 |
Source: Public Records
Map
Nearby Homes
- 1496 Horace Greeley Ave
- 1566 Horace Greeley Ave
- 1812 Jack Bell Ct
- 1339 Meadow Crest Dr
- 1293 Meadow Crest Dr
- 2647 Cold Creek Trail
- 2613 Fountain Ave
- 2524 Cattlemans Trail
- 1222 Sierra Blvd
- 2573 Rose Ave
- 45 Maiden Hair Ct Unit Lot45
- 2405 Marshall Trail
- 2569 Alma Ave
- 1184 Lone Indian Trail
- 2480 Sierra House Trail
- 1121 Sundown Trail
- 1145 Sierra Blvd
- 1124 Martin Ave
- 2664 Knox Ave
- 2684 Knox Ave
- 1505 Ormsby Dr
- 1515 Ormsby Dr
- 1504 Black Bart Ave
- 1496 Black Bart Ave
- 1514 Black Bart Ave
- 1512 Ormsby Dr
- 1495 Ormsby Dr
- 1529 Ormsby Dr
- 1520 Ormsby Dr
- 1504 Ormsby Dr
- 1488 Black Bart Ave
- 1494 Ormsby Dr
- 1507 Black Bart Ave
- 1499 Black Bart Ave
- 1513 Black Bart Ave
- 1537 Ormsby Dr
- 1489 Ormsby Dr
- 1534 Ormsby Dr
- 1559 Ormsby Dr
- 1482 Black Bart Ave