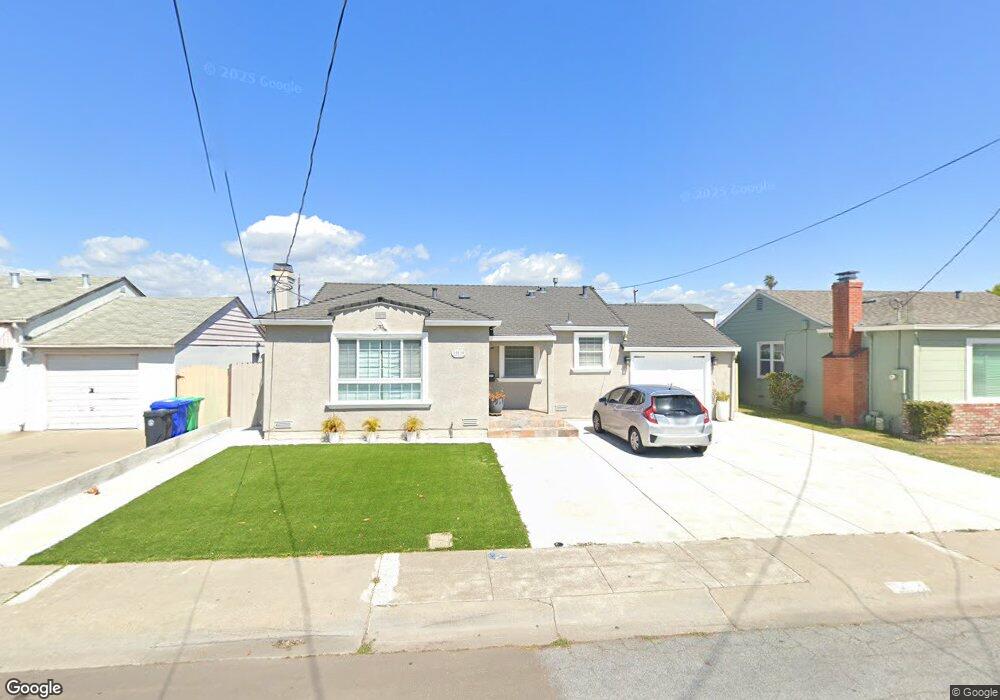
15130 Beatty St San Leandro, CA 94579
Washington Manor-Bonaire NeighborhoodEstimated Value: $725,000 - $803,000
3
Beds
1
Bath
1,020
Sq Ft
$754/Sq Ft
Est. Value
About This Home
This home is located at 15130 Beatty St, San Leandro, CA 94579 and is currently estimated at $768,655, approximately $753 per square foot. 15130 Beatty St is a home located in Alameda County with nearby schools including Dayton Elementary School, Washington Manor Middle School, and Arroyo High School.
Ownership History
Date
Name
Owned For
Owner Type
Purchase Details
Closed on
Jan 30, 2019
Sold by
Vidal Editha A
Bought by
Vidal Editha Adriano and Editha Vidal Living Trust
Current Estimated Value
Purchase Details
Closed on
Dec 12, 1997
Sold by
Vidal Edgar Y
Bought by
Vidal Edgar Y and Vidal Editha A
Home Financials for this Owner
Home Financials are based on the most recent Mortgage that was taken out on this home.
Original Mortgage
$150,500
Outstanding Balance
$25,439
Interest Rate
7.22%
Estimated Equity
$743,216
Purchase Details
Closed on
Dec 11, 1995
Sold by
Wong Alfredo
Bought by
Vidal Edgar Y
Purchase Details
Closed on
Jan 28, 1994
Sold by
Lynch Francis K and Lynch Sandra L
Bought by
Wong Alfredo and Vidal Edgar Y
Home Financials for this Owner
Home Financials are based on the most recent Mortgage that was taken out on this home.
Original Mortgage
$152,000
Interest Rate
4.12%
Create a Home Valuation Report for This Property
The Home Valuation Report is an in-depth analysis detailing your home's value as well as a comparison with similar homes in the area
Home Values in the Area
Average Home Value in this Area
Purchase History
| Date | Buyer | Sale Price | Title Company |
|---|---|---|---|
| Vidal Editha Adriano | -- | None Available | |
| Vidal Edgar Y | -- | Placer Title Company | |
| Vidal Edgar Y | -- | -- | |
| Wong Alfredo | $160,000 | First American Title Guarant | |
| Wong Alfredo | -- | First American Title Guarant |
Source: Public Records
Mortgage History
| Date | Status | Borrower | Loan Amount |
|---|---|---|---|
| Open | Vidal Edgar Y | $150,500 | |
| Previous Owner | Wong Alfredo | $152,000 |
Source: Public Records
Tax History Compared to Growth
Tax History
| Year | Tax Paid | Tax Assessment Tax Assessment Total Assessment is a certain percentage of the fair market value that is determined by local assessors to be the total taxable value of land and additions on the property. | Land | Improvement |
|---|---|---|---|---|
| 2025 | $3,778 | $264,935 | $81,580 | $190,355 |
| 2024 | $3,778 | $259,604 | $79,981 | $186,623 |
| 2023 | $3,772 | $261,377 | $78,413 | $182,964 |
| 2022 | $3,704 | $249,251 | $76,875 | $179,376 |
| 2021 | $3,594 | $244,228 | $75,368 | $175,860 |
| 2020 | $3,505 | $248,651 | $74,595 | $174,056 |
| 2019 | $3,498 | $243,777 | $73,133 | $170,644 |
| 2018 | $3,260 | $238,997 | $71,699 | $167,298 |
| 2017 | $3,111 | $234,313 | $70,294 | $164,019 |
| 2016 | $3,029 | $229,720 | $68,916 | $160,804 |
| 2015 | $2,960 | $226,270 | $67,881 | $158,389 |
| 2014 | $2,915 | $221,837 | $66,551 | $155,286 |
Source: Public Records
Map
Nearby Homes
- 15106 Edgemoor St
- 15102 Chapel Ct
- 720 Fargo Ave Unit 14
- 1311 Hubbard Ave
- 700 Fargo Ave Unit 2
- 700 Fargo Ave Unit 12
- 15049 Kesterson St
- 670 Fargo Ave Unit 5
- 650 Fargo Ave Unit 4
- 15009 Kesterson St
- 747 Lewelling Blvd
- 747 Lewelling Blvd Unit SPC 22
- 15535 Sedgeman St
- 840 Woodgate Dr
- 15596 Tilden St
- 15373 Inverness St
- 15512 Farnsworth St
- 117 Santa Teresa
- 1950 Randy St
- 829 Crespi Dr
- 15138 Beatty St
- 15122 Beatty St
- 15153 Andover St
- 15167 Andover St
- 15145 Andover St
- 15114 Beatty St
- 1091 Fargo Ave
- 15121 Beatty St
- 15175 Andover St
- 15137 Andover St
- 15106 Beatty St
- 15113 Beatty St
- 15125 Andover St
- 1108 Fargo Ave
- 15189 Andover St
- 15105 Beatty St
- 15098 Beatty St
- 15158 Andover St
- 15148 Andover St
- 15095 Andover St