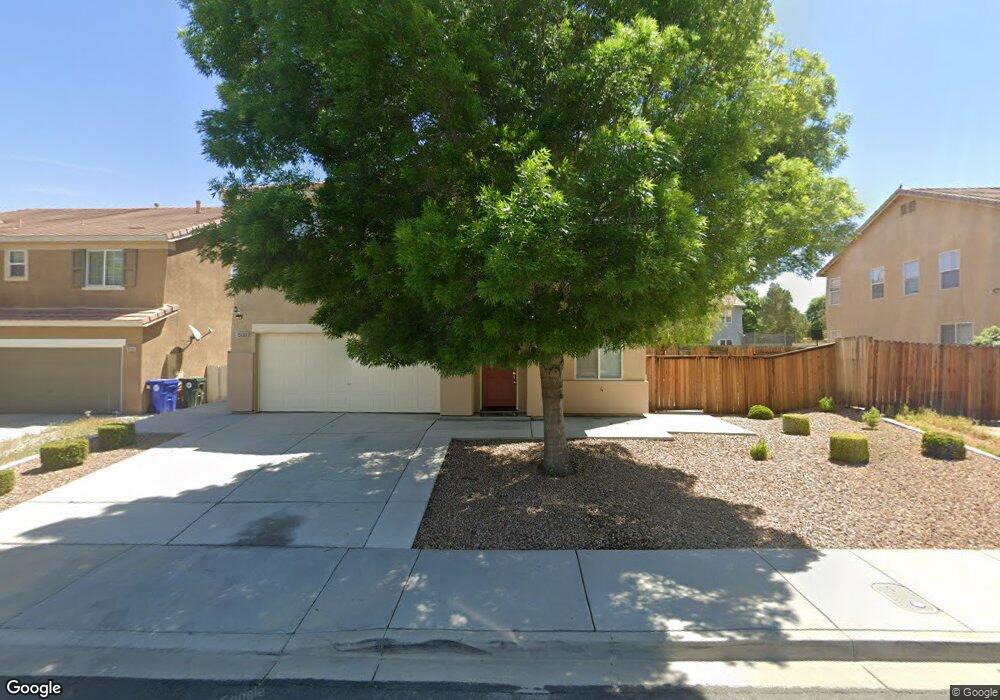
15133 Foal Ct Victorville, CA 92394
Estimated Value: $415,029 - $459,000
3
Beds
2
Baths
2,262
Sq Ft
$192/Sq Ft
Est. Value
About This Home
This home is located at 15133 Foal Ct, Victorville, CA 92394 and is currently estimated at $433,757, approximately $191 per square foot. 15133 Foal Ct is a home located in San Bernardino County with nearby schools including Brentwood Elementary School, Village Elementary School, and Challenger School Of Sports And Fitness.
Ownership History
Date
Name
Owned For
Owner Type
Purchase Details
Closed on
Mar 27, 2012
Sold by
Dlj Mortgage Capital Inc
Bought by
Namaki Mohammad and Azarnia Esmat
Current Estimated Value
Purchase Details
Closed on
Jan 31, 2012
Sold by
U S Bank National Association
Bought by
Dlj Mortgage Capital
Purchase Details
Closed on
Oct 11, 2011
Sold by
Rivera Andrew Frank and Saldana Rivera Josephine T
Bought by
U S Bank National Association
Purchase Details
Closed on
Jan 14, 2004
Sold by
Kb Home Greater Los Angeles Inc
Bought by
Rivera Andrew Frank and Saldana Rivera Josephine T
Home Financials for this Owner
Home Financials are based on the most recent Mortgage that was taken out on this home.
Original Mortgage
$261,785
Interest Rate
5.85%
Mortgage Type
VA
Create a Home Valuation Report for This Property
The Home Valuation Report is an in-depth analysis detailing your home's value as well as a comparison with similar homes in the area
Home Values in the Area
Average Home Value in this Area
Purchase History
| Date | Buyer | Sale Price | Title Company |
|---|---|---|---|
| Namaki Mohammad | $123,000 | Placer Title Company | |
| Dlj Mortgage Capital | -- | Placer Title Company | |
| U S Bank National Association | $115,000 | First American | |
| Rivera Andrew Frank | $262,000 | Fidelity-Riverside |
Source: Public Records
Mortgage History
| Date | Status | Borrower | Loan Amount |
|---|---|---|---|
| Previous Owner | Rivera Andrew Frank | $261,785 |
Source: Public Records
Tax History Compared to Growth
Tax History
| Year | Tax Paid | Tax Assessment Tax Assessment Total Assessment is a certain percentage of the fair market value that is determined by local assessors to be the total taxable value of land and additions on the property. | Land | Improvement |
|---|---|---|---|---|
| 2025 | $1,890 | $154,496 | $25,121 | $129,375 |
| 2024 | $1,890 | $151,466 | $24,628 | $126,838 |
| 2023 | $1,872 | $148,496 | $24,145 | $124,351 |
| 2022 | $1,841 | $145,585 | $23,672 | $121,913 |
| 2021 | $1,809 | $142,731 | $23,208 | $119,523 |
| 2020 | $1,777 | $141,267 | $22,970 | $118,297 |
| 2019 | $1,749 | $138,497 | $22,520 | $115,977 |
| 2018 | $1,859 | $135,781 | $22,078 | $113,703 |
| 2017 | $1,823 | $133,119 | $21,645 | $111,474 |
| 2016 | $1,788 | $130,509 | $21,221 | $109,288 |
| 2015 | $1,727 | $128,548 | $20,902 | $107,646 |
| 2014 | $1,922 | $126,030 | $20,493 | $105,537 |
Source: Public Records
Map
Nearby Homes
- 14172 Paddock Rd
- 14199 Estate Way
- 14096 Estate Way
- 14049 Estate Way
- 14115 Buckskin Ct
- 14993 Brown Ln
- 14285 Wildcat Ln
- 13986 Estate Way
- 14416 Honeyhill St
- 14304 Gray Fox Ln
- 14412 Moon Valley St
- 14117 Gopher Canyon Rd
- 15121 Sorrel Rd
- 15115 Fresh Water Way
- 15255 Sunray Ct
- 14780 Butterfly Ct
- 15203 Zircon Dr
- Residence 1310 Plan at Dawson Pointe at West Creek
- Residence 1583 Plan at Dawson Pointe at West Creek
- Residence 2057 Plan at Dawson Pointe at West Creek
- 15141 Foal Ct
- 15121 Foal Ct
- 15132 Paddock Cir
- 15124 Paddock Cir
- 15142 Paddock Cir
- 15134 Foal Ct
- 15124 Foal Ct
- 15142 Foal Ct
- 15116 Foal Ct
- 14152 Paddock Rd
- 14162 Paddock Rd
- 15108 Foal Ct
- 15108 Roan Cir
- 14158 Roan Rd
- 14180 Paddock Rd
- 14138 Paddock Rd
- 15133 Pasture Way
- 14197 Paddock Rd
- 15121 Pasture Way
- 15141 Pasture Way