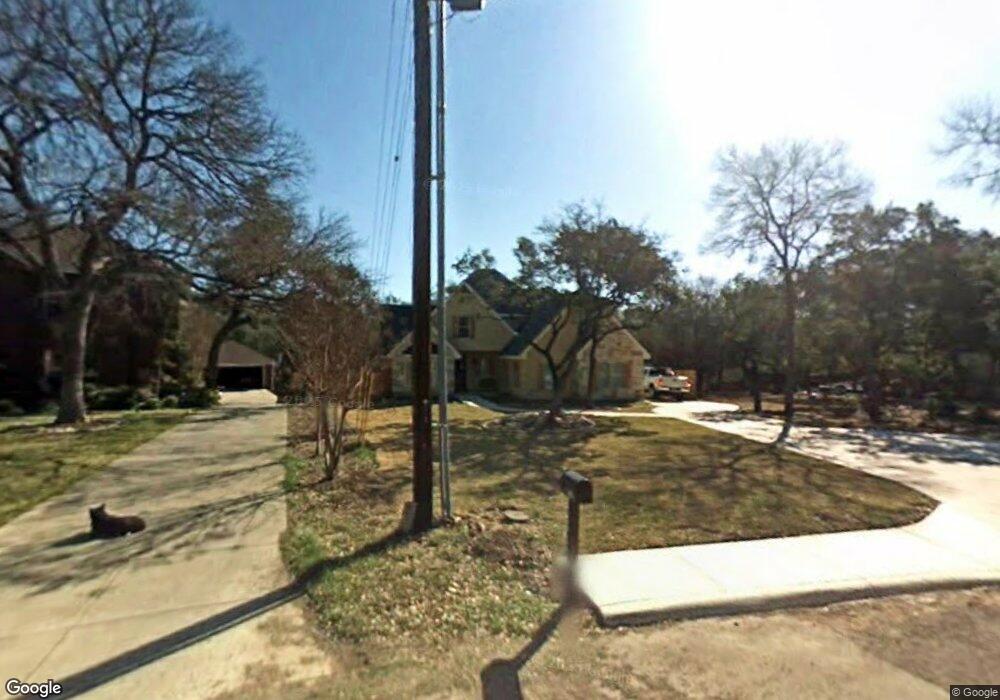
15135 Flying Cir Helotes, TX 78023
Estimated Value: $540,000 - $625,376
3
Beds
3
Baths
2,474
Sq Ft
$239/Sq Ft
Est. Value
About This Home
This home is located at 15135 Flying Cir, Helotes, TX 78023 and is currently estimated at $590,844, approximately $238 per square foot. 15135 Flying Cir is a home located in Bexar County with nearby schools including Helotes Elementary School, Garcia Middle School, and O'Connor High School.
Ownership History
Date
Name
Owned For
Owner Type
Purchase Details
Closed on
Jun 23, 2011
Sold by
Samudio Stacie K
Bought by
Samudio Damon M
Current Estimated Value
Purchase Details
Closed on
Dec 3, 2007
Sold by
Ervin Neal and Ervin Carrie
Bought by
Samudio Damon and Samudio Stacie
Home Financials for this Owner
Home Financials are based on the most recent Mortgage that was taken out on this home.
Original Mortgage
$65,000
Interest Rate
6.43%
Mortgage Type
Purchase Money Mortgage
Purchase Details
Closed on
Sep 6, 2006
Sold by
Hl & B Mortgage Inc
Bought by
Ervin Neal and Ervin Carrie
Home Financials for this Owner
Home Financials are based on the most recent Mortgage that was taken out on this home.
Original Mortgage
$237,500
Interest Rate
12.95%
Mortgage Type
Construction
Purchase Details
Closed on
Mar 1, 2006
Sold by
Woods Charles T and The Frank D Villaneo Jr & Eliz
Bought by
Hl & B Mortgage Inc
Create a Home Valuation Report for This Property
The Home Valuation Report is an in-depth analysis detailing your home's value as well as a comparison with similar homes in the area
Home Values in the Area
Average Home Value in this Area
Purchase History
| Date | Buyer | Sale Price | Title Company |
|---|---|---|---|
| Samudio Damon M | -- | None Available | |
| Samudio Damon | -- | Lalt | |
| Ervin Neal | -- | Fatco Sa | |
| Hl & B Mortgage Inc | -- | Fatco |
Source: Public Records
Mortgage History
| Date | Status | Borrower | Loan Amount |
|---|---|---|---|
| Closed | Samudio Damon | $65,000 | |
| Previous Owner | Ervin Neal | $237,500 | |
| Closed | Samudio Damon M | $0 |
Source: Public Records
Tax History Compared to Growth
Tax History
| Year | Tax Paid | Tax Assessment Tax Assessment Total Assessment is a certain percentage of the fair market value that is determined by local assessors to be the total taxable value of land and additions on the property. | Land | Improvement |
|---|---|---|---|---|
| 2025 | $8,007 | $480,000 | $117,560 | $362,440 |
| 2024 | $8,007 | $520,000 | $117,560 | $402,440 |
| 2023 | $8,007 | $503,330 | $117,560 | $442,440 |
| 2022 | $8,937 | $440,000 | $85,180 | $415,040 |
| 2021 | $8,421 | $400,000 | $76,060 | $323,940 |
| 2020 | $8,710 | $405,000 | $46,270 | $358,730 |
| 2019 | $9,104 | $410,000 | $51,860 | $358,140 |
| 2018 | $8,956 | $403,000 | $51,860 | $351,140 |
| 2017 | $8,369 | $375,782 | $51,860 | $347,420 |
| 2016 | $7,608 | $341,620 | $51,860 | $289,760 |
| 2015 | $6,645 | $337,018 | $51,860 | $290,210 |
| 2014 | $6,645 | $306,380 | $0 | $0 |
Source: Public Records
Map
Nearby Homes
- 15125 Flying Cir
- 15352 Texas Highway 16
- 0 Bandera Rd
- 15149 Marin Hollow
- 10513 Far Reaches Ln
- 433 Private Rd
- 15766 La Subida Trail
- 10212 Whip o Will Way
- 10096 Whip o Will Way
- 16202 Ondara
- 9852 Marnoch
- 14239
- 14465 Chinquapin
- 15921 Reyes Ridge
- 11006 Bar x Trail
- 16227 Ondara
- 10515 Cima Vista
- 14125 Iron Horse Way
- 10330 Salamanca
- 10811 Newcroft Place
- 15145 Flying Cir
- 15155 Flying Cir
- 15115 Flying Cir
- 15165 Flying Cir
- 15154 Flying Cir
- 15105 Flying Cir
- 15114 Flying Cir
- 15175 Flying Cir
- 10444 Cage Ln
- 15241 Bandera Rd
- 15184 Flying Cir
- 10434 Cage Ln
- 15185 Flying Cir
- 15194 Flying Cir
- 15525 Flying Cir
- 15515 Flying Cir
- 10424 Cage Ln
- 10435 Cage Ln
- 15505 Flying Cir
- 15195 Flying Cir