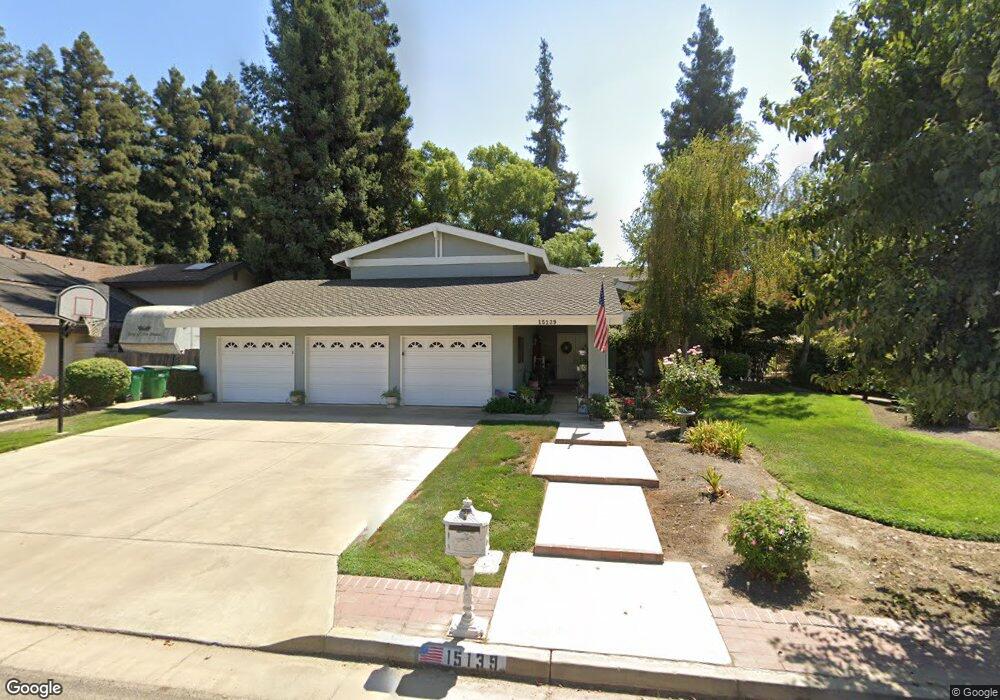
15139 El Rancho St Visalia, CA 93292
Estimated Value: $525,000 - $643,000
4
Beds
3
Baths
2,743
Sq Ft
$215/Sq Ft
Est. Value
About This Home
This home is located at 15139 El Rancho St, Visalia, CA 93292 and is currently estimated at $588,988, approximately $214 per square foot. 15139 El Rancho St is a home located in Tulare County with nearby schools including Elbow Creek Elementary School, Valley Oak Middle School, and Golden West High School.
Ownership History
Date
Name
Owned For
Owner Type
Purchase Details
Closed on
Jun 30, 2022
Sold by
Cheatwood Philip O and Cheatwood Georgette M
Bought by
2013 Philip And Georgette Cheatwood Revocable
Current Estimated Value
Create a Home Valuation Report for This Property
The Home Valuation Report is an in-depth analysis detailing your home's value as well as a comparison with similar homes in the area
Home Values in the Area
Average Home Value in this Area
Purchase History
| Date | Buyer | Sale Price | Title Company |
|---|---|---|---|
| 2013 Philip And Georgette Cheatwood Revocable | -- | None Listed On Document |
Source: Public Records
Tax History Compared to Growth
Tax History
| Year | Tax Paid | Tax Assessment Tax Assessment Total Assessment is a certain percentage of the fair market value that is determined by local assessors to be the total taxable value of land and additions on the property. | Land | Improvement |
|---|---|---|---|---|
| 2025 | $3,004 | $292,205 | $90,185 | $202,020 |
| 2024 | $3,004 | $286,476 | $88,417 | $198,059 |
| 2023 | $2,920 | $280,860 | $86,684 | $194,176 |
| 2022 | $2,788 | $275,354 | $84,985 | $190,369 |
| 2021 | $2,790 | $269,955 | $83,319 | $186,636 |
| 2020 | $2,770 | $267,187 | $82,465 | $184,722 |
| 2019 | $2,685 | $261,948 | $80,848 | $181,100 |
| 2018 | $2,620 | $256,812 | $79,263 | $177,549 |
| 2017 | $2,587 | $251,777 | $77,709 | $174,068 |
| 2016 | $2,542 | $246,840 | $76,185 | $170,655 |
| 2015 | $2,467 | $243,133 | $75,041 | $168,092 |
| 2014 | $2,467 | $238,370 | $73,571 | $164,799 |
Source: Public Records
Map
Nearby Homes
- 31162 Hacienda Rd
- 15151 Lipson Ave
- 4045 E Magnolia St
- 4144 E Magnolia St
- 4124 E Magnolia St
- 4032 E Magnolia St
- 4101 E Magnolia St
- 4141 E Magnolia St
- 4203 E Magnolia St
- 4227 E Magnolia St
- 4216 E Magnolia St
- Dupont Plan at Larkspur
- Cabot Plan at Larkspur
- Auburn Plan at Larkspur
- Essex Plan at Larkspur
- Gardner Plan at Larkspur
- Abernathy Plan at Larkspur
- 1649 N Comstock Ct
- 1139 N Citrus Ct
- 0 Avenue 320
- 15145 El Rancho St
- 15125 El Rancho St
- 15145 El Rancho Ave
- 15159 El Rancho St
- 31082 Appaloosa Rd
- 31082 Appaloosa Rd
- 15140 El Rancho Ave
- 15140 El Rancho St
- 15171 El Rancho St
- 15126 El Rancho St
- 31101 Mountain View St
- 15114 El Rancho St
- 15183 El Rancho St
- 31113 Mountain View St
- 15102 El Rancho St
- 31100 Mountain View St Unit 1
- 31100 Mountain View St
- 15121 Oak Ranch Dr
- 15088 El Rancho St
- 15127 Oak Ranch Dr