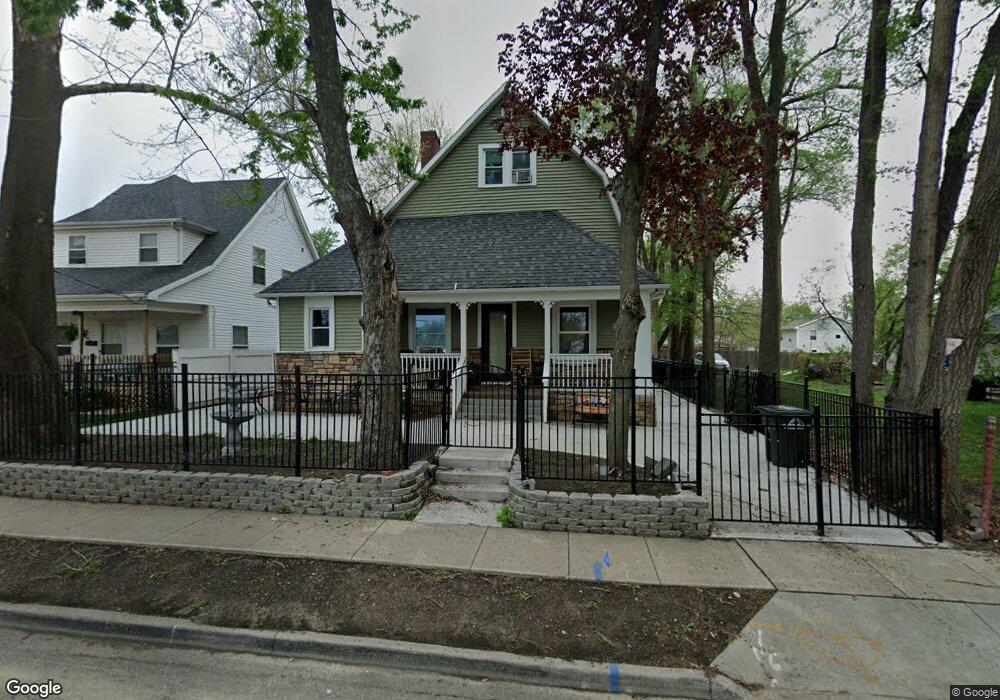
1514 11th St Des Moines, IA 50314
King Irving NeighborhoodEstimated Value: $172,000 - $226,000
5
Beds
2
Baths
2,077
Sq Ft
$94/Sq Ft
Est. Value
About This Home
This home is located at 1514 11th St, Des Moines, IA 50314 and is currently estimated at $195,915, approximately $94 per square foot. 1514 11th St is a home located in Polk County with nearby schools including Moulton Elementary School, Harding Middle School, and North High School.
Ownership History
Date
Name
Owned For
Owner Type
Purchase Details
Closed on
Jul 18, 2023
Sold by
Valenzuela Julio Cesar and Valenzuela Claudia Roci
Bought by
Escalante Claudia Rocio Molina
Current Estimated Value
Purchase Details
Closed on
Aug 4, 2015
Sold by
Equity Trust Co and Weinstein Frank E
Bought by
Valenzuela Julio Cesar
Purchase Details
Closed on
May 17, 2006
Sold by
Bustillos Jorge C and Bustillos Claudia
Bought by
Valenzuela Julio Cesar
Purchase Details
Closed on
Apr 29, 2005
Sold by
Bustillos Jorge C
Bought by
Bustillos Jorge C and Valenzuela Julio Cesar
Purchase Details
Closed on
Jul 22, 2004
Sold by
Equity Trust Co
Bought by
Bustillos Jorge C
Home Financials for this Owner
Home Financials are based on the most recent Mortgage that was taken out on this home.
Original Mortgage
$49,500
Interest Rate
5.73%
Mortgage Type
Seller Take Back
Purchase Details
Closed on
Nov 15, 2002
Sold by
Mid Ohio Securities Corp
Bought by
Perez Juan and Hernandez Minerva
Home Financials for this Owner
Home Financials are based on the most recent Mortgage that was taken out on this home.
Original Mortgage
$47,000
Interest Rate
9%
Mortgage Type
Land Contract Argmt. Of Sale
Purchase Details
Closed on
Aug 28, 2001
Sold by
Mid Ohio Securities Corp
Bought by
Rice Neighbors Rozinna M
Home Financials for this Owner
Home Financials are based on the most recent Mortgage that was taken out on this home.
Original Mortgage
$50,400
Interest Rate
10%
Mortgage Type
Land Contract Argmt. Of Sale
Purchase Details
Closed on
Nov 8, 1999
Sold by
Contract Exchange Corp
Bought by
Mid Ohio Securities Corp
Home Financials for this Owner
Home Financials are based on the most recent Mortgage that was taken out on this home.
Original Mortgage
$40,500
Interest Rate
10%
Mortgage Type
Seller Take Back
Purchase Details
Closed on
Oct 19, 1999
Sold by
Jones Jeffrey P
Bought by
Contract Exchange Corp
Home Financials for this Owner
Home Financials are based on the most recent Mortgage that was taken out on this home.
Original Mortgage
$40,500
Interest Rate
10%
Mortgage Type
Seller Take Back
Create a Home Valuation Report for This Property
The Home Valuation Report is an in-depth analysis detailing your home's value as well as a comparison with similar homes in the area
Home Values in the Area
Average Home Value in this Area
Purchase History
| Date | Buyer | Sale Price | Title Company |
|---|---|---|---|
| Escalante Claudia Rocio Molina | -- | None Listed On Document | |
| Escalante Claudia Rocio Molina | -- | None Listed On Document | |
| Valenzuela Julio Cesar | $53,000 | Attorney | |
| Valenzuela Julio Cesar | -- | None Available | |
| Bustillos Jorge C | -- | -- | |
| Bustillos Jorge C | $53,000 | -- | |
| Perez Juan | $53,000 | -- | |
| Rice Neighbors Rozinna M | $51,900 | -- | |
| Mid Ohio Securities Corp | -- | -- | |
| Contract Exchange Corp | -- | -- | |
| Ordonez Juan | $48,500 | -- |
Source: Public Records
Mortgage History
| Date | Status | Borrower | Loan Amount |
|---|---|---|---|
| Previous Owner | Bustillos Jorge C | $49,500 | |
| Previous Owner | Perez Juan | $47,000 | |
| Previous Owner | Rice Neighbors Rozinna M | $50,400 | |
| Previous Owner | Ordonez Juan | $40,500 |
Source: Public Records
Tax History Compared to Growth
Tax History
| Year | Tax Paid | Tax Assessment Tax Assessment Total Assessment is a certain percentage of the fair market value that is determined by local assessors to be the total taxable value of land and additions on the property. | Land | Improvement |
|---|---|---|---|---|
| 2025 | $2,606 | $166,700 | $14,200 | $152,500 |
| 2024 | $2,606 | $142,900 | $12,100 | $130,800 |
| 2023 | $2,214 | $142,900 | $12,100 | $130,800 |
| 2022 | $2,194 | $102,800 | $9,200 | $93,600 |
| 2021 | $2,052 | $102,800 | $9,200 | $93,600 |
| 2020 | $2,126 | $90,800 | $8,200 | $82,600 |
| 2019 | $1,492 | $90,800 | $8,200 | $82,600 |
| 2018 | $1,470 | $64,000 | $7,300 | $56,700 |
| 2017 | $1,742 | $64,000 | $7,300 | $56,700 |
| 2016 | $1,698 | $64,400 | $7,300 | $57,100 |
| 2015 | $1,698 | $64,400 | $7,300 | $57,100 |
| 2014 | $1,470 | $57,400 | $7,200 | $50,200 |
Source: Public Records
Map
Nearby Homes