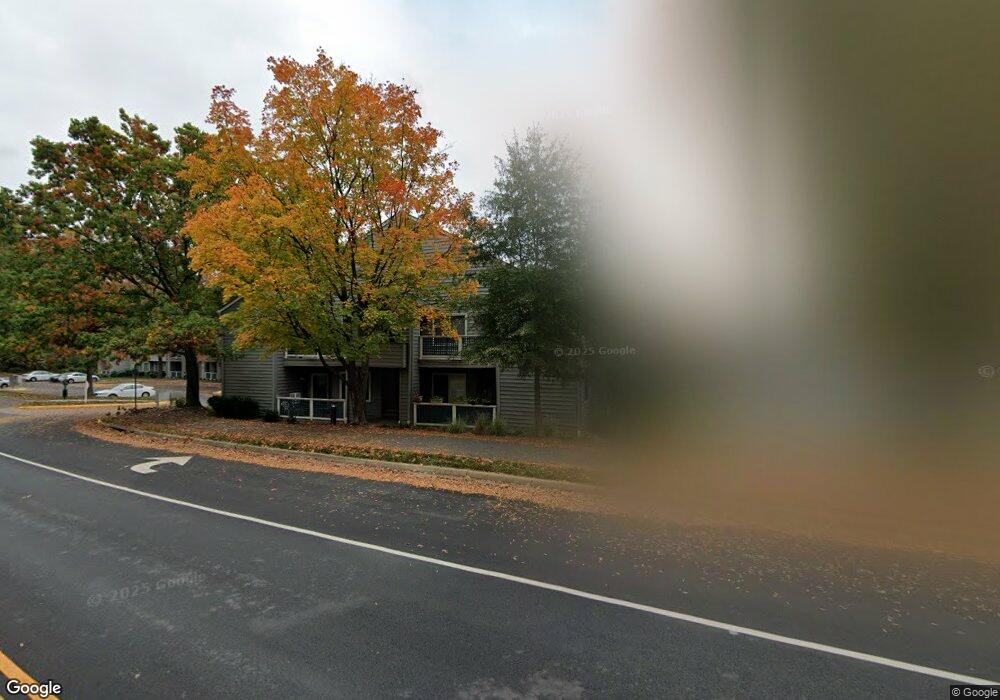
1514-E Summerchase Ct Reston, VA 20194
North Reston NeighborhoodEstimated Value: $348,228 - $393,000
2
Beds
1
Bath
952
Sq Ft
$382/Sq Ft
Est. Value
About This Home
This home is located at 1514-E Summerchase Ct, Reston, VA 20194 and is currently estimated at $363,557, approximately $381 per square foot. 1514-E Summerchase Ct is a home located in Fairfax County with nearby schools including Armstrong Elementary, Herndon Middle School, and Herndon High School.
Ownership History
Date
Name
Owned For
Owner Type
Purchase Details
Closed on
Oct 30, 2020
Sold by
Lemmons Perry
Bought by
Parsa Russell and The Russell Parsa Revocable Tr
Current Estimated Value
Purchase Details
Closed on
May 17, 2016
Sold by
Ryan Anna
Bought by
Lemmons Perry
Home Financials for this Owner
Home Financials are based on the most recent Mortgage that was taken out on this home.
Original Mortgage
$253,085
Interest Rate
3.59%
Mortgage Type
New Conventional
Purchase Details
Closed on
Mar 16, 2010
Sold by
Henderson Sean K
Bought by
Ryan Anna
Purchase Details
Closed on
Jun 28, 2004
Sold by
Henderson Danielle
Bought by
Henderson Sean K
Home Financials for this Owner
Home Financials are based on the most recent Mortgage that was taken out on this home.
Original Mortgage
$180,000
Interest Rate
6.3%
Mortgage Type
Purchase Money Mortgage
Create a Home Valuation Report for This Property
The Home Valuation Report is an in-depth analysis detailing your home's value as well as a comparison with similar homes in the area
Home Values in the Area
Average Home Value in this Area
Purchase History
| Date | Buyer | Sale Price | Title Company |
|---|---|---|---|
| Parsa Russell | $274,000 | Accommodation | |
| Lemmons Perry | $245,000 | Universal Title | |
| Ryan Anna | $210,000 | -- | |
| Henderson Sean K | $225,000 | -- |
Source: Public Records
Mortgage History
| Date | Status | Borrower | Loan Amount |
|---|---|---|---|
| Previous Owner | Lemmons Perry | $253,085 | |
| Previous Owner | Henderson Sean K | $180,000 |
Source: Public Records
Tax History Compared to Growth
Tax History
| Year | Tax Paid | Tax Assessment Tax Assessment Total Assessment is a certain percentage of the fair market value that is determined by local assessors to be the total taxable value of land and additions on the property. | Land | Improvement |
|---|---|---|---|---|
| 2025 | $3,731 | $324,960 | $65,000 | $259,960 |
| 2024 | $3,731 | $309,490 | $62,000 | $247,490 |
| 2023 | $3,465 | $294,750 | $59,000 | $235,750 |
| 2022 | $3,180 | $278,070 | $56,000 | $222,070 |
| 2021 | $3,172 | $259,880 | $52,000 | $207,880 |
| 2020 | $3,105 | $252,310 | $50,000 | $202,310 |
| 2019 | $2,872 | $233,400 | $47,000 | $186,400 |
| 2018 | $2,684 | $233,400 | $47,000 | $186,400 |
| 2017 | $2,764 | $228,820 | $46,000 | $182,820 |
| 2016 | $2,899 | $240,440 | $48,000 | $192,440 |
| 2015 | $2,677 | $230,150 | $46,000 | $184,150 |
| 2014 | $2,566 | $221,070 | $44,000 | $177,070 |
Source: Public Records
Map
Nearby Homes
- 11723 Summerchase Cir
- 11737 Summerchase Cir
- 11725 Arbor Glen Way
- 1616 Barnstead Dr
- 1532 Church Hill Place
- 1548 Poplar Grove Dr
- 1483 Church Hill Place
- 1403 Church Hill Place
- 11504 Turnbridge Ln
- 11598 Newport Cove Ln
- 1307 Windleaf Dr Unit 139
- 11603 Auburn Grove Ct
- 1350 Red Hawk Cir
- 1747 Sundance Dr
- 11555 Southington Ln
- 1750 Sundance Dr
- 1624 Fellowship Square
- 1620 Fellowship Square
- 1314 Garden Wall Cir Unit C
- 1609 Fellowship Square
- 1516 Summerchase Court B Unit 1516
- 1516 Summerchase Court A Unit A
- 1514 Summerchase Ct Unit 1514-B
- 1514 Summerchase Ct Unit 1514C
- 1516 Summerchase Ct Unit C
- 1516 Summerchase Ct Unit B
- 1516 Summerchase Ct Unit A
- 1514 Summerchase Ct Unit C
- 1516 Summerchase Ct Unit 1516
- 1514 Summerchase Ct Unit 1514-E
- 1516 Summerchase Ct Unit 1516-B
- 1514 Summerchase Ct
- 1514 Summerchase Ct Unit B
- 1516 Summerchase Ct
- 1516 Summerchase Court C Unit C
- 1516 Summerchase Court C Unit 1516C
- 1516-C Summerchase Ct
- 1516-B Summerchase Ct
- 1516-A Summerchase Ct
- 1516-E Summerchase Ct