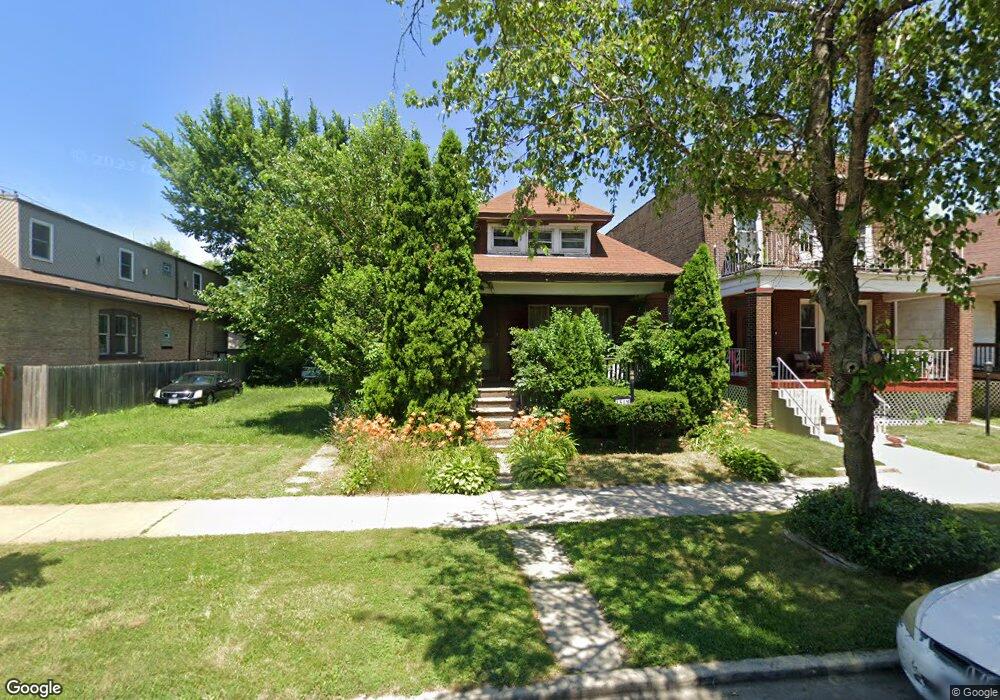
1514 W 71st Place Chicago, IL 60636
Englewood NeighborhoodEstimated Value: $107,000 - $193,000
3
Beds
1
Bath
1,150
Sq Ft
$124/Sq Ft
Est. Value
About This Home
This home is located at 1514 W 71st Place, Chicago, IL 60636 and is currently estimated at $142,272, approximately $123 per square foot. 1514 W 71st Place is a home located in Cook County with nearby schools including Wentworth Elementary School, The Montessori School of Englewood Charter School, and Providence-Englewood Elementary Charter School.
Create a Home Valuation Report for This Property
The Home Valuation Report is an in-depth analysis detailing your home's value as well as a comparison with similar homes in the area
Home Values in the Area
Average Home Value in this Area
Tax History Compared to Growth
Tax History
| Year | Tax Paid | Tax Assessment Tax Assessment Total Assessment is a certain percentage of the fair market value that is determined by local assessors to be the total taxable value of land and additions on the property. | Land | Improvement |
|---|---|---|---|---|
| 2024 | $883 | $5,300 | $1,125 | $4,175 |
| 2023 | $861 | $4,188 | $2,438 | $1,750 |
| 2022 | $861 | $4,188 | $2,438 | $1,750 |
| 2021 | $842 | $4,187 | $2,437 | $1,750 |
| 2020 | $1,359 | $6,102 | $2,812 | $3,290 |
| 2019 | $1,362 | $6,780 | $2,812 | $3,968 |
| 2018 | $1,339 | $6,780 | $2,812 | $3,968 |
| 2017 | $1,785 | $8,293 | $2,437 | $5,856 |
| 2016 | $1,661 | $8,293 | $2,437 | $5,856 |
| 2015 | $1,520 | $8,293 | $2,437 | $5,856 |
| 2014 | $1,345 | $7,251 | $2,250 | $5,001 |
| 2013 | $1,319 | $7,251 | $2,250 | $5,001 |
Source: Public Records
Map
Nearby Homes
- 1508 W 72nd St
- 1500 W 71st St
- 7241 S Marshfield Ave
- 7253 S Marshfield Ave
- 7225 S Paulina St
- 1408 W 71st Place
- 1467 W 73rd St
- 7244 S Paulina St
- 7254 S Paulina St
- 7010 S Paulina St
- 7228 S Hermitage Ave
- 6946 S Loomis Blvd
- 6953 S Loomis Blvd
- 1809 W 71st St
- 7015 S Wood St
- 7050 S Throop St
- 7133 S Honore St
- 7252 S Wood St
- 6929 S Loomis Blvd
- 1624 W 69th St
- 1510 W 71st Place
- 1518 W 71st Place
- 1508 W 71st Place
- 1520 W 71st Place
- 1504 W 71st Place
- 1502 W 71st St
- 1539 W 71st St Unit 2
- 1539 W 71st St
- 1535 W 71st St
- 1543 W 71st St
- 7110 S Laflin St
- 7110 S Laflin St
- 1533 W 71st St Unit 1333
- 1533 W 71st St
- 7119 S Ashland Ave
- 1529 W 71st St
- 1545 W 71st St
- 1545 W 71st St
- 1519 W 71st Place
- 1519 W 71st Place Unit 3