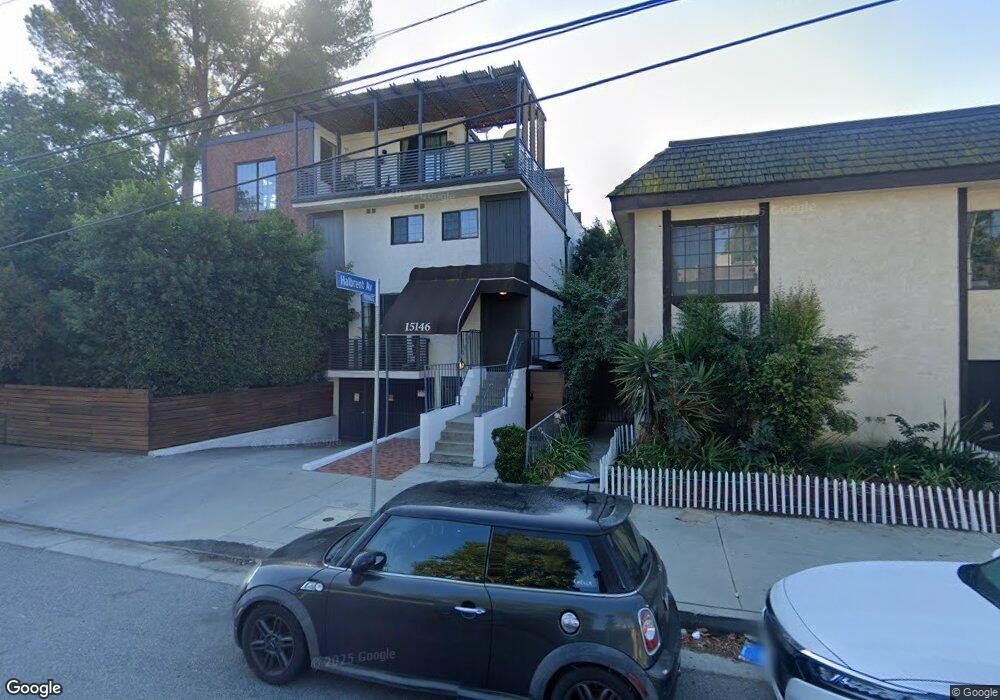
15146 Magnolia Blvd Unit 5 Sherman Oaks, CA 91403
Estimated Value: $698,000 - $885,000
2
Beds
3
Baths
1,397
Sq Ft
$558/Sq Ft
Est. Value
About This Home
This home is located at 15146 Magnolia Blvd Unit 5, Sherman Oaks, CA 91403 and is currently estimated at $779,264, approximately $557 per square foot. 15146 Magnolia Blvd Unit 5 is a home located in Los Angeles County with nearby schools including Kester Avenue Elementary School, Van Nuys High School, and Ivy Bound Academy of Math Sci and Tech Charter Middle.
Ownership History
Date
Name
Owned For
Owner Type
Purchase Details
Closed on
Mar 9, 2022
Sold by
Cynthia Rotberger Separate Property Trus
Bought by
Goldsholl Joshua
Current Estimated Value
Purchase Details
Closed on
Mar 26, 2013
Sold by
Rotberger Cynthia
Bought by
Rotberger Cynthia and Cynthia Rotberger Separate Property Trus
Purchase Details
Closed on
Mar 15, 2013
Sold by
Rotberger Leo
Bought by
Rotberger Cynthia
Purchase Details
Closed on
Oct 8, 2003
Sold by
Rotberger Leo
Bought by
Rotberger Leo and Rotberger Cynthia
Purchase Details
Closed on
Aug 8, 1997
Sold by
Rotberger Norman L
Bought by
Rotberger Norman Leo and Rotberger Cynthia L
Home Financials for this Owner
Home Financials are based on the most recent Mortgage that was taken out on this home.
Original Mortgage
$50,000
Interest Rate
7.57%
Create a Home Valuation Report for This Property
The Home Valuation Report is an in-depth analysis detailing your home's value as well as a comparison with similar homes in the area
Home Values in the Area
Average Home Value in this Area
Purchase History
| Date | Buyer | Sale Price | Title Company |
|---|---|---|---|
| Goldsholl Joshua | -- | Hasting Carl D | |
| Rotberger Cynthia | -- | None Available | |
| Rotberger Cynthia | -- | None Available | |
| Rotberger Leo | -- | -- | |
| Rotberger Norman Leo | -- | Fidelity National Title Co |
Source: Public Records
Mortgage History
| Date | Status | Borrower | Loan Amount |
|---|---|---|---|
| Previous Owner | Rotberger Norman Leo | $50,000 |
Source: Public Records
Tax History Compared to Growth
Tax History
| Year | Tax Paid | Tax Assessment Tax Assessment Total Assessment is a certain percentage of the fair market value that is determined by local assessors to be the total taxable value of land and additions on the property. | Land | Improvement |
|---|---|---|---|---|
| 2025 | $8,281 | $697,067 | $278,827 | $418,240 |
| 2024 | $8,281 | $683,400 | $273,360 | $410,040 |
| 2023 | $8,202 | $670,000 | $268,000 | $402,000 |
| 2022 | $2,495 | $200,314 | $60,139 | $140,175 |
| 2021 | $2,458 | $196,387 | $58,960 | $137,427 |
| 2019 | $2,384 | $190,563 | $57,212 | $133,351 |
| 2018 | $2,357 | $186,828 | $56,091 | $130,737 |
| 2016 | $2,247 | $179,575 | $53,914 | $125,661 |
| 2015 | $2,215 | $176,879 | $53,105 | $123,774 |
| 2014 | $2,229 | $173,415 | $52,065 | $121,350 |
Source: Public Records
Map
Nearby Homes
- 15215 Magnolia Blvd Unit 102
- 15215 Magnolia Blvd Unit 131
- 15137 Magnolia Blvd Unit A
- 15161 Magnolia Blvd Unit F
- 15133 Magnolia Blvd Unit E
- 15330 Weddington St
- 15248 Clark St Unit 104
- 15344 Weddington St
- 5306 Norwich Ave
- 5425 Halbrent Ave
- 5351 Lemona Ave
- 15220 Valleyheart Dr
- 5510 Columbus Ave
- 5115 Kester Ave Unit 14
- 5115 Kester Ave Unit 202
- 14857 Hartsook St
- 15123 Killion St
- 5070 Kester Ave Unit 12
- 15217 Burbank Blvd
- 14800 Mccormick St
- 15146 Magnolia Blvd Unit 4
- 15146 Magnolia Blvd Unit 3
- 15146 Magnolia Blvd Unit 2
- 15142 Magnolia Blvd
- 5170 Columbus Ave Unit 7
- 5170 Columbus Ave
- 5170 Columbus Ave Unit 6
- 15147 Hartsook St
- 15153 Hartsook St
- 15132 Magnolia Blvd
- 15143 Hartsook St
- 15200 W Magnolia Blvd Unit 203
- 15200 W Magnolia Blvd Unit 302
- 15200 W Magnolia Blvd Unit 304
- 15200 W Magnolia Blvd Unit 204
- 15200 W Magnolia Blvd Unit 104
- 15200 W Magnolia Blvd Unit 101
- 15200 W Magnolia Blvd Unit 301
- 15200 W Magnolia Blvd Unit 103
- 15200 W Magnolia Blvd Unit 102