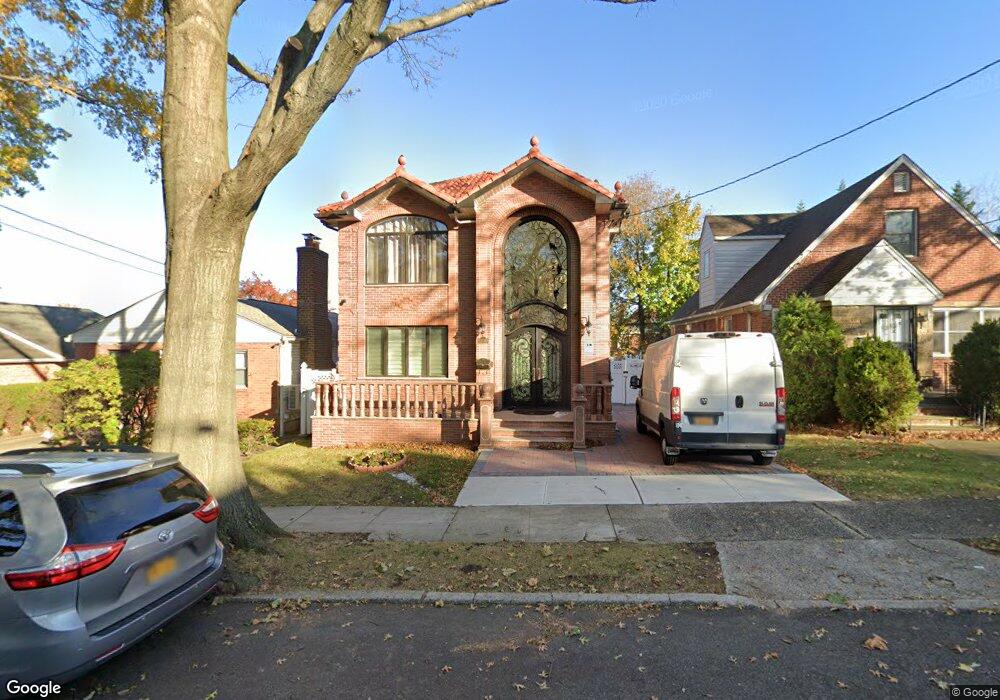
15149 28th Ave Flushing, NY 11354
Flushing NeighborhoodEstimated Value: $1,358,000 - $1,887,000
--
Bed
--
Bath
2,000
Sq Ft
$796/Sq Ft
Est. Value
About This Home
This home is located at 15149 28th Ave, Flushing, NY 11354 and is currently estimated at $1,592,059, approximately $796 per square foot. 15149 28th Ave is a home located in Queens County with nearby schools including P.S. 21 Edward Hart, Jhs 185 Edward Bleeker, and Flushing High School.
Ownership History
Date
Name
Owned For
Owner Type
Purchase Details
Closed on
Oct 16, 2024
Sold by
Huang Ouyang and Zhang Diana Q
Bought by
Huang Lejing
Current Estimated Value
Home Financials for this Owner
Home Financials are based on the most recent Mortgage that was taken out on this home.
Original Mortgage
$400,000
Outstanding Balance
$395,866
Interest Rate
6.44%
Mortgage Type
Purchase Money Mortgage
Estimated Equity
$1,196,193
Purchase Details
Closed on
Aug 10, 2018
Sold by
Huang Jiansheng and Huang Ouyang
Bought by
Huang Ouyang and Zhang Diana Q
Purchase Details
Closed on
May 11, 2015
Sold by
Bono James P
Bought by
Huang Jiansheng and Huang Ouyang
Purchase Details
Closed on
Dec 14, 2001
Sold by
Jozefowicz Edmund J
Bought by
Bono James P
Home Financials for this Owner
Home Financials are based on the most recent Mortgage that was taken out on this home.
Original Mortgage
$315,000
Interest Rate
6.84%
Create a Home Valuation Report for This Property
The Home Valuation Report is an in-depth analysis detailing your home's value as well as a comparison with similar homes in the area
Home Values in the Area
Average Home Value in this Area
Purchase History
| Date | Buyer | Sale Price | Title Company |
|---|---|---|---|
| Huang Lejing | $1,850,000 | -- | |
| Huang Ouyang | -- | -- | |
| Huang Ouyang | -- | -- | |
| Huang Jiansheng | $650,000 | -- | |
| Huang Jiansheng | $650,000 | -- | |
| Bono James P | -- | -- | |
| Bono James P | -- | -- |
Source: Public Records
Mortgage History
| Date | Status | Borrower | Loan Amount |
|---|---|---|---|
| Open | Huang Lejing | $400,000 | |
| Previous Owner | Bono James P | $315,000 |
Source: Public Records
Tax History Compared to Growth
Tax History
| Year | Tax Paid | Tax Assessment Tax Assessment Total Assessment is a certain percentage of the fair market value that is determined by local assessors to be the total taxable value of land and additions on the property. | Land | Improvement |
|---|---|---|---|---|
| 2025 | $11,451 | $59,286 | $11,416 | $47,870 |
| 2024 | $11,451 | $57,014 | $11,377 | $45,637 |
| 2023 | $10,803 | $53,787 | $11,850 | $41,937 |
| 2022 | $7,597 | $75,120 | $16,140 | $58,980 |
| 2021 | $10,679 | $72,180 | $16,140 | $56,040 |
| 2020 | $10,458 | $66,360 | $16,140 | $50,220 |
| 2019 | $9,952 | $70,260 | $16,140 | $54,120 |
| 2018 | $9,346 | $45,846 | $11,419 | $34,427 |
| 2017 | $5,724 | $28,080 | $11,141 | $16,939 |
| 2016 | $5,613 | $28,080 | $11,141 | $16,939 |
| 2014 | -- | $25,440 | $16,150 | $9,290 |
Source: Public Records
Map
Nearby Homes
- 151-44 28th Ave
- 154-23 28th Ave
- 27-19 Murray St
- 154-19 26th Ave
- 28-11 Murray St
- 151-26 Bayside Ave
- 28-14 157th St
- 154-43 25th Dr
- 150-31 27th Ave
- 154-04 25th Ave
- 30-27 Murray Ln
- 15016 26th Ave
- 157-18 26th Ave
- 3225 155th St
- 15008 Bayside Ave
- 32-18 157th St
- 152-18 33rd Ave
- 33-06 154th St
- 151-14 33rd Ave
- 24-11 157th St
- 15149 28th Ave
- 15153 28th Ave
- 151-45 28th Ave
- 15145 28th Ave
- 15157 28th Ave
- 15141 28th Ave
- 15148 27th Ave
- 15152 27th Ave
- 15144 27th Ave
- 15161 28th Ave
- 15137 28th Ave
- 15156 27th Ave
- 15140 27th Ave
- 15156 27th Ave
- 151-48 27th Ave
- 15165 28th Ave
- 15136 27th Ave
- 15150 28th Ave
- 15133 28th Ave
- 15152 28th Ave