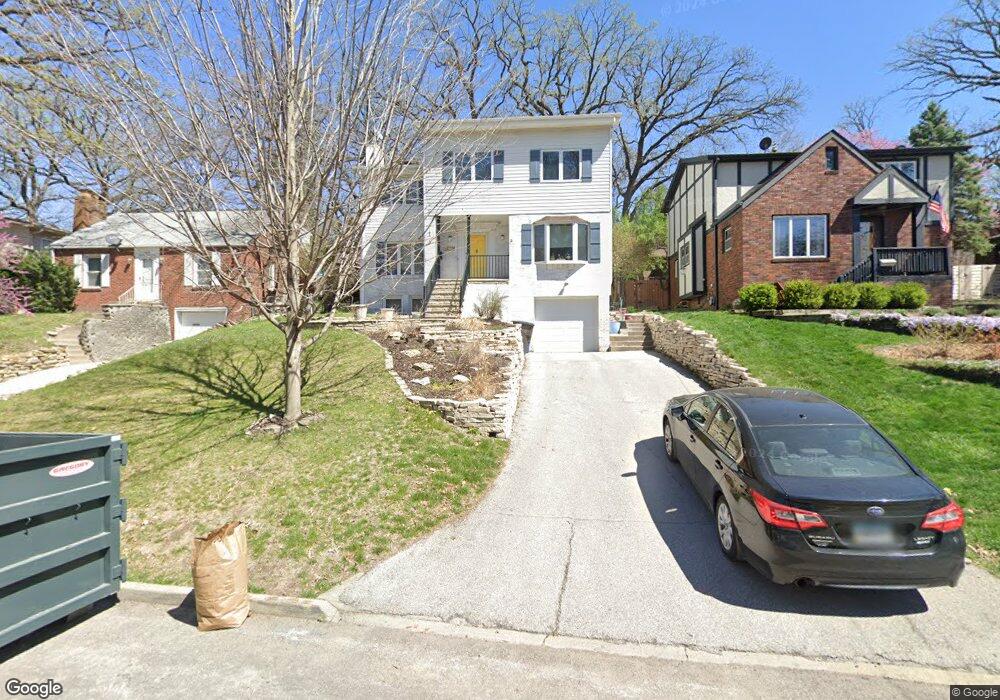
1515 41st Place Des Moines, IA 50311
Beaverdale NeighborhoodEstimated Value: $352,000 - $436,000
3
Beds
3
Baths
2,138
Sq Ft
$180/Sq Ft
Est. Value
About This Home
This home is located at 1515 41st Place, Des Moines, IA 50311 and is currently estimated at $384,906, approximately $180 per square foot. 1515 41st Place is a home located in Polk County with nearby schools including Perkins Elementary School, Merrill Middle School, and Roosevelt High School.
Ownership History
Date
Name
Owned For
Owner Type
Purchase Details
Closed on
Jun 27, 2016
Sold by
Palmer Jason A and Palmer Amelia
Bought by
Mueller Brittany J and Boneshefski Michael
Current Estimated Value
Purchase Details
Closed on
Apr 30, 2007
Sold by
Briedis Mikelis and Briedis Mary Jo
Bought by
Palmer Jason A and Nuss Amelia D
Home Financials for this Owner
Home Financials are based on the most recent Mortgage that was taken out on this home.
Original Mortgage
$219,900
Interest Rate
6.2%
Mortgage Type
Purchase Money Mortgage
Create a Home Valuation Report for This Property
The Home Valuation Report is an in-depth analysis detailing your home's value as well as a comparison with similar homes in the area
Home Values in the Area
Average Home Value in this Area
Purchase History
| Date | Buyer | Sale Price | Title Company |
|---|---|---|---|
| Mueller Brittany J | $236,500 | None Available | |
| Palmer Jason A | $219,500 | Itc |
Source: Public Records
Mortgage History
| Date | Status | Borrower | Loan Amount |
|---|---|---|---|
| Previous Owner | Palmer Jason A | $219,900 |
Source: Public Records
Tax History Compared to Growth
Tax History
| Year | Tax Paid | Tax Assessment Tax Assessment Total Assessment is a certain percentage of the fair market value that is determined by local assessors to be the total taxable value of land and additions on the property. | Land | Improvement |
|---|---|---|---|---|
| 2025 | $6,744 | $387,400 | $36,800 | $350,600 |
| 2024 | $6,744 | $353,300 | $33,100 | $320,200 |
| 2023 | $6,984 | $353,300 | $33,100 | $320,200 |
| 2022 | $6,928 | $305,200 | $29,200 | $276,000 |
| 2021 | $6,776 | $305,200 | $29,200 | $276,000 |
| 2020 | $7,034 | $280,100 | $26,700 | $253,400 |
| 2019 | $6,618 | $280,100 | $26,700 | $253,400 |
| 2018 | $6,546 | $254,800 | $23,800 | $231,000 |
| 2017 | $6,174 | $254,800 | $23,800 | $231,000 |
| 2016 | $5,786 | $228,300 | $20,900 | $207,400 |
| 2015 | $5,786 | $228,300 | $20,900 | $207,400 |
| 2014 | $5,264 | $214,500 | $19,300 | $195,200 |
Source: Public Records
Map
Nearby Homes
- 1503 42nd St
- 1534 41st St
- 1529 41st St
- 1541 42nd St
- 1541 44th St
- 1347 44th St
- 3919 Maquoketa Dr
- 1659 Northwest Dr
- 1314 44th St
- 1333 39th St
- 1415 46th St
- 1725 41st St
- 1669 Beaver Ave
- 3827 Carpenter Ave
- 1206 39th St
- 1653 Marella Trail
- 4000 University Ave Unit 7
- 4004 Franklin Ave
- 1310 47th St
- 3821 University Ave