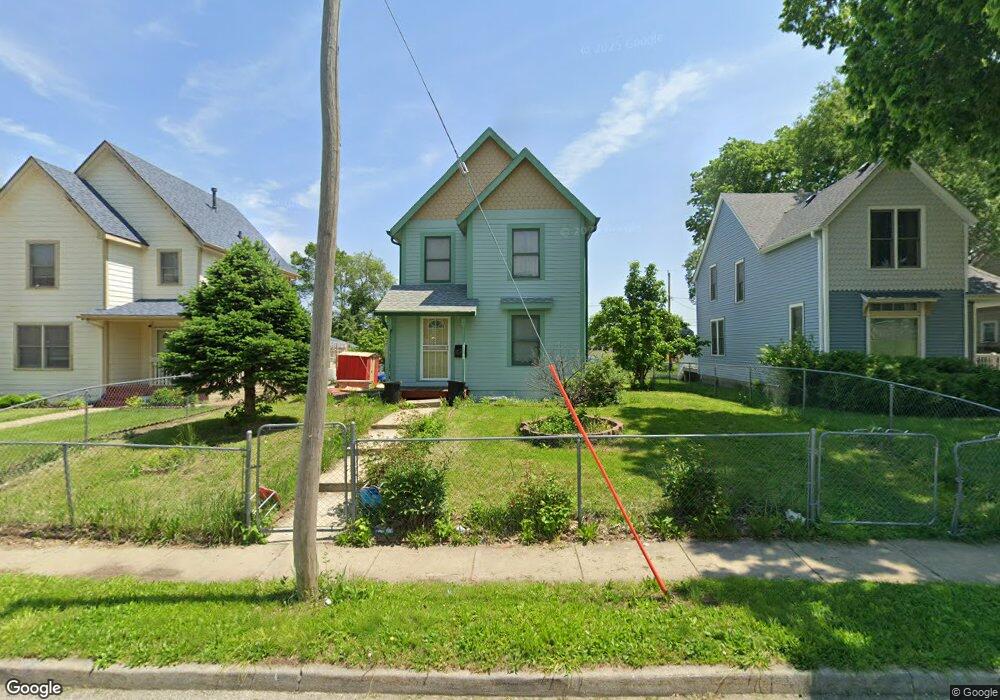
1515 7th St Des Moines, IA 50314
River Bend NeighborhoodEstimated Value: $161,000 - $187,000
3
Beds
2
Baths
1,008
Sq Ft
$175/Sq Ft
Est. Value
About This Home
This home is located at 1515 7th St, Des Moines, IA 50314 and is currently estimated at $176,526, approximately $175 per square foot. 1515 7th St is a home located in Polk County with nearby schools including Moulton Elementary School, Harding Middle School, and North High School.
Ownership History
Date
Name
Owned For
Owner Type
Purchase Details
Closed on
Jan 4, 2001
Sold by
Community Housing Development Corp
Bought by
Nguyen Toan Bao and Vo Da Thi
Current Estimated Value
Home Financials for this Owner
Home Financials are based on the most recent Mortgage that was taken out on this home.
Original Mortgage
$59,377
Outstanding Balance
$21,991
Interest Rate
7.77%
Mortgage Type
FHA
Estimated Equity
$154,535
Purchase Details
Closed on
Jun 20, 2000
Sold by
Polk County Iowa
Bought by
Community Housing Development Corp
Create a Home Valuation Report for This Property
The Home Valuation Report is an in-depth analysis detailing your home's value as well as a comparison with similar homes in the area
Home Values in the Area
Average Home Value in this Area
Purchase History
| Date | Buyer | Sale Price | Title Company |
|---|---|---|---|
| Nguyen Toan Bao | $71,500 | -- | |
| Community Housing Development Corp | -- | -- |
Source: Public Records
Mortgage History
| Date | Status | Borrower | Loan Amount |
|---|---|---|---|
| Open | Nguyen Toan Bao | $59,377 |
Source: Public Records
Tax History Compared to Growth
Tax History
| Year | Tax Paid | Tax Assessment Tax Assessment Total Assessment is a certain percentage of the fair market value that is determined by local assessors to be the total taxable value of land and additions on the property. | Land | Improvement |
|---|---|---|---|---|
| 2025 | $2,538 | $155,100 | $9,000 | $146,100 |
| 2024 | $2,538 | $139,500 | $8,000 | $131,500 |
| 2023 | $2,254 | $139,500 | $8,000 | $131,500 |
| 2022 | $2,234 | $104,500 | $6,100 | $98,400 |
| 2021 | $2,106 | $104,500 | $6,100 | $98,400 |
| 2020 | $2,182 | $93,000 | $5,400 | $87,600 |
| 2019 | $2,200 | $93,000 | $5,400 | $87,600 |
| 2018 | $2,172 | $90,400 | $5,200 | $85,200 |
| 2017 | $2,020 | $90,400 | $5,200 | $85,200 |
| 2016 | $1,962 | $83,200 | $4,700 | $78,500 |
| 2015 | $1,962 | $83,200 | $4,700 | $78,500 |
| 2014 | $1,822 | $80,100 | $4,600 | $75,500 |
Source: Public Records
Map
Nearby Homes