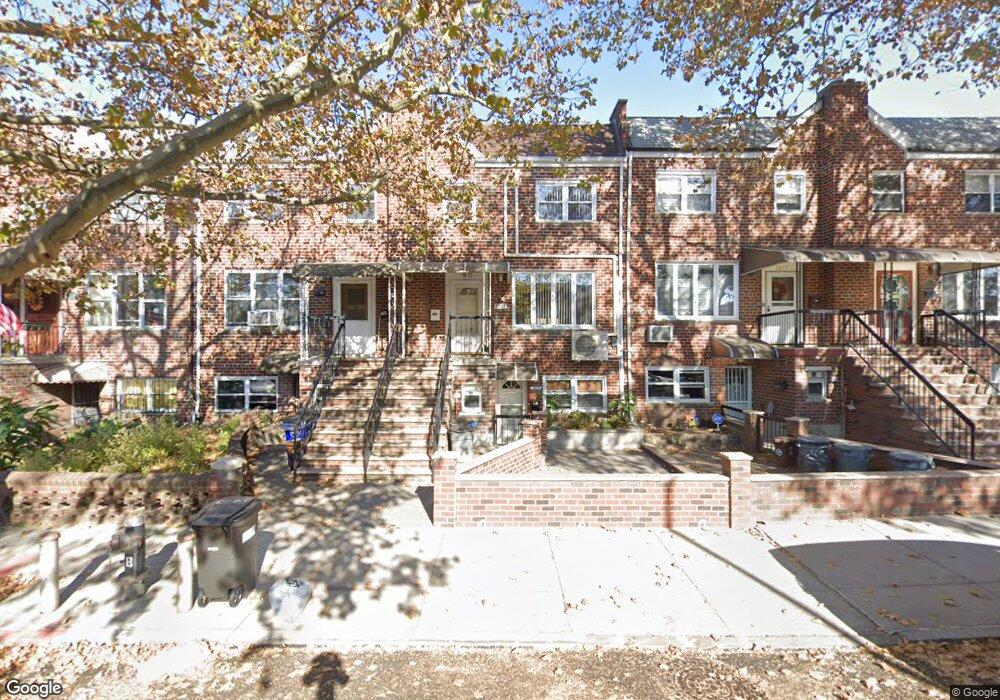
1515 85th St Brooklyn, NY 11228
Bensonhurst NeighborhoodEstimated Value: $1,287,306 - $1,381,000
--
Bed
--
Bath
1,824
Sq Ft
$733/Sq Ft
Est. Value
About This Home
This home is located at 1515 85th St, Brooklyn, NY 11228 and is currently estimated at $1,336,827, approximately $732 per square foot. 1515 85th St is a home located in Kings County with nearby schools including P.S. 204 Vince Lombardi, IS 201 Madeleine Brennan Intermediate School, and New Utrecht High School.
Ownership History
Date
Name
Owned For
Owner Type
Purchase Details
Closed on
Aug 17, 2009
Sold by
Tagliavia Jack J
Bought by
Seto Check and Seto Stephanie Chen
Current Estimated Value
Home Financials for this Owner
Home Financials are based on the most recent Mortgage that was taken out on this home.
Original Mortgage
$450,000
Outstanding Balance
$292,803
Interest Rate
5.17%
Mortgage Type
Purchase Money Mortgage
Estimated Equity
$1,044,024
Create a Home Valuation Report for This Property
The Home Valuation Report is an in-depth analysis detailing your home's value as well as a comparison with similar homes in the area
Home Values in the Area
Average Home Value in this Area
Purchase History
| Date | Buyer | Sale Price | Title Company |
|---|---|---|---|
| Seto Check | $670,000 | -- |
Source: Public Records
Mortgage History
| Date | Status | Borrower | Loan Amount |
|---|---|---|---|
| Open | Seto Check | $450,000 |
Source: Public Records
Tax History Compared to Growth
Tax History
| Year | Tax Paid | Tax Assessment Tax Assessment Total Assessment is a certain percentage of the fair market value that is determined by local assessors to be the total taxable value of land and additions on the property. | Land | Improvement |
|---|---|---|---|---|
| 2025 | $8,715 | $65,880 | $16,860 | $49,020 |
| 2024 | $8,715 | $64,380 | $16,860 | $47,520 |
| 2023 | $8,812 | $67,860 | $16,860 | $51,000 |
| 2022 | $8,296 | $60,420 | $16,860 | $43,560 |
| 2021 | $8,437 | $61,080 | $16,860 | $44,220 |
| 2020 | $3,948 | $58,500 | $16,860 | $41,640 |
| 2019 | $7,515 | $58,500 | $16,860 | $41,640 |
| 2018 | $7,311 | $37,324 | $10,498 | $26,826 |
| 2017 | $7,004 | $35,830 | $10,521 | $25,309 |
| 2016 | $6,603 | $34,579 | $12,115 | $22,464 |
| 2015 | $3,857 | $32,624 | $13,428 | $19,196 |
| 2014 | $3,857 | $31,104 | $13,294 | $17,810 |
Source: Public Records
Map
Nearby Homes