Estimated Value: $876,678 - $1,005,000
3
Beds
3
Baths
1,700
Sq Ft
$565/Sq Ft
Est. Value
About This Home
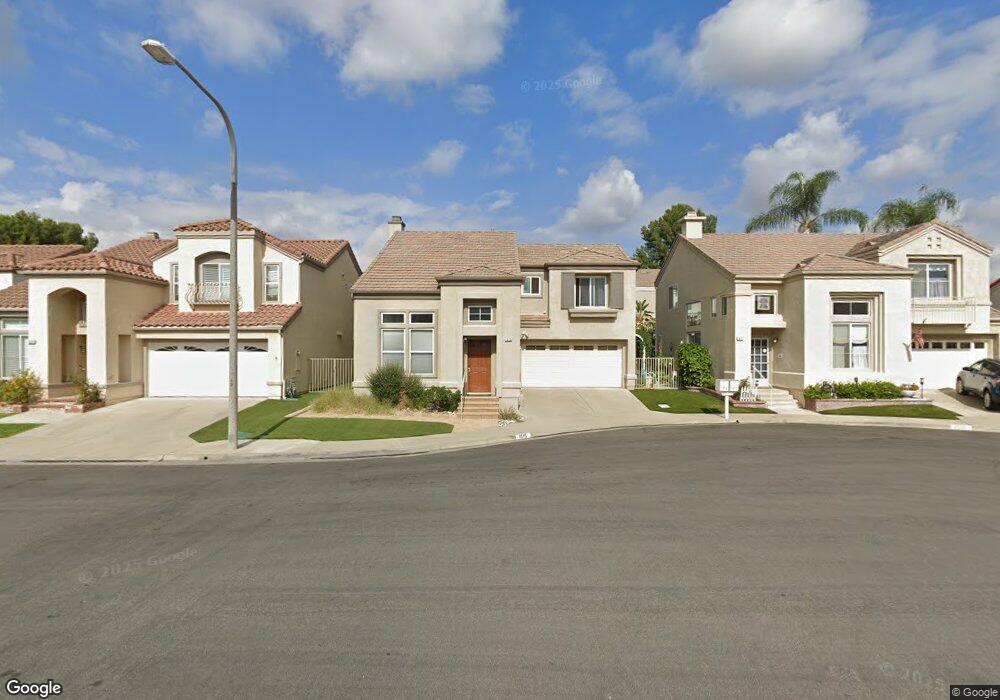
This home is located at 1515 Alexander Ct, Brea, CA 92821 and is currently estimated at $959,920, approximately $564 per square foot. 1515 Alexander Ct is a home located in Orange County with nearby schools including Ladera Palma Elementary School, Sierra Vista Elementary School, and Washington Middle School.
Ownership History
Date
Name
Owned For
Owner Type
Purchase Details
Closed on
Jun 14, 2002
Sold by
Duru Chika and Duru Ijeoma R
Bought by
Yoseph Eyal
Current Estimated Value
Home Financials for this Owner
Home Financials are based on the most recent Mortgage that was taken out on this home.
Original Mortgage
$272,000
Interest Rate
5.75%
Purchase Details
Closed on
Mar 17, 2001
Sold by
Duru Ijeoma R
Bought by
Duru Chika and Duru Ijeoma R
Home Financials for this Owner
Home Financials are based on the most recent Mortgage that was taken out on this home.
Original Mortgage
$30,000
Interest Rate
6.97%
Purchase Details
Closed on
Jul 27, 1994
Sold by
Duru Ebenzer Chika
Bought by
Duru Ijeoma R
Purchase Details
Closed on
Mar 23, 1994
Sold by
Brea Vista Partners
Bought by
Duru Ijeoma R
Home Financials for this Owner
Home Financials are based on the most recent Mortgage that was taken out on this home.
Original Mortgage
$197,900
Interest Rate
6%
Create a Home Valuation Report for This Property
The Home Valuation Report is an in-depth analysis detailing your home's value as well as a comparison with similar homes in the area
Home Values in the Area
Average Home Value in this Area
Purchase History
| Date | Buyer | Sale Price | Title Company |
|---|---|---|---|
| Yoseph Eyal | $340,000 | Chicago Title Co | |
| Duru Chika | -- | First American Title Ins Co | |
| Duru Ijeoma R | -- | First American Title Ins Co | |
| Duru Ijeoma R | $220,000 | First American Title Ins |
Source: Public Records
Mortgage History
| Date | Status | Borrower | Loan Amount |
|---|---|---|---|
| Previous Owner | Yoseph Eyal | $272,000 | |
| Previous Owner | Duru Chika | $30,000 | |
| Previous Owner | Duru Ijeoma R | $197,900 |
Source: Public Records
Tax History Compared to Growth
Tax History
| Year | Tax Paid | Tax Assessment Tax Assessment Total Assessment is a certain percentage of the fair market value that is determined by local assessors to be the total taxable value of land and additions on the property. | Land | Improvement |
|---|---|---|---|---|
| 2025 | $5,963 | $502,270 | $251,295 | $250,975 |
| 2024 | $5,963 | $492,422 | $246,368 | $246,054 |
| 2023 | $5,827 | $482,767 | $241,537 | $241,230 |
| 2022 | $5,766 | $473,301 | $236,801 | $236,500 |
| 2021 | $5,672 | $464,021 | $232,158 | $231,863 |
| 2020 | $5,618 | $459,264 | $229,778 | $229,486 |
| 2019 | $5,464 | $450,259 | $225,272 | $224,987 |
| 2018 | $5,372 | $441,431 | $220,855 | $220,576 |
| 2017 | $5,276 | $432,776 | $216,525 | $216,251 |
| 2016 | $5,152 | $424,291 | $212,280 | $212,011 |
| 2015 | $5,007 | $417,918 | $209,091 | $208,827 |
| 2014 | $4,861 | $409,732 | $204,995 | $204,737 |
Source: Public Records
Map
Nearby Homes
- 1506 Bergman Ct
- 1414 W Central Ave Unit 88
- 1341 Harbor Lake Ave Unit 24
- 1663 Gatewood Ct
- 685 View Lake Cir Unit 161
- 755 Village Lake Mall Unit 337
- 1371 Pleasant Lake Place Unit 105
- 1508 Mccart Ave
- 1261 Glen Lake Ave Unit 279
- 2300 Lake Forest Cir Unit 113
- 726 Knoll Lake Dr Unit 264
- 2201 Lake View Dr Unit 20
- 686 Wood Lake Dr Unit 8
- 2121 Lake Side Dr Unit 158
- 551 Lake Grove Way Unit 165
- 2240 Lake Glen Dr Unit 56
- 521 Forest Lake Dr Unit 64
- 1936 Skywood St
- 224 S Fonda St
- 2211 Frantz Ave
- 1519 Alexander Ct
- 1511 Alexander Ct
- 1518 Allyson Ct
- 1514 Allyson Ct
- 1522 Allyson Ct
- 1523 Alexander Ct
- 1507 Alexander Ct
- 1526 Allyson Ct
- 1510 Allyson Ct
- 1516 Alexander Ct
- 1520 Alexander Ct
- 1512 Alexander Ct
- 1527 Alexander Ct
- 1508 Alexander Ct
- 1524 Alexander Ct
- 1530 Allyson Ct
- 1528 Alexander Ct
- 1513 Bergman Ct
- 1517 Allyson Ct
- 1517 Bergman Ct