Estimated Value: $153,912 - $200,000
3
Beds
1
Bath
2,188
Sq Ft
$82/Sq Ft
Est. Value
About This Home
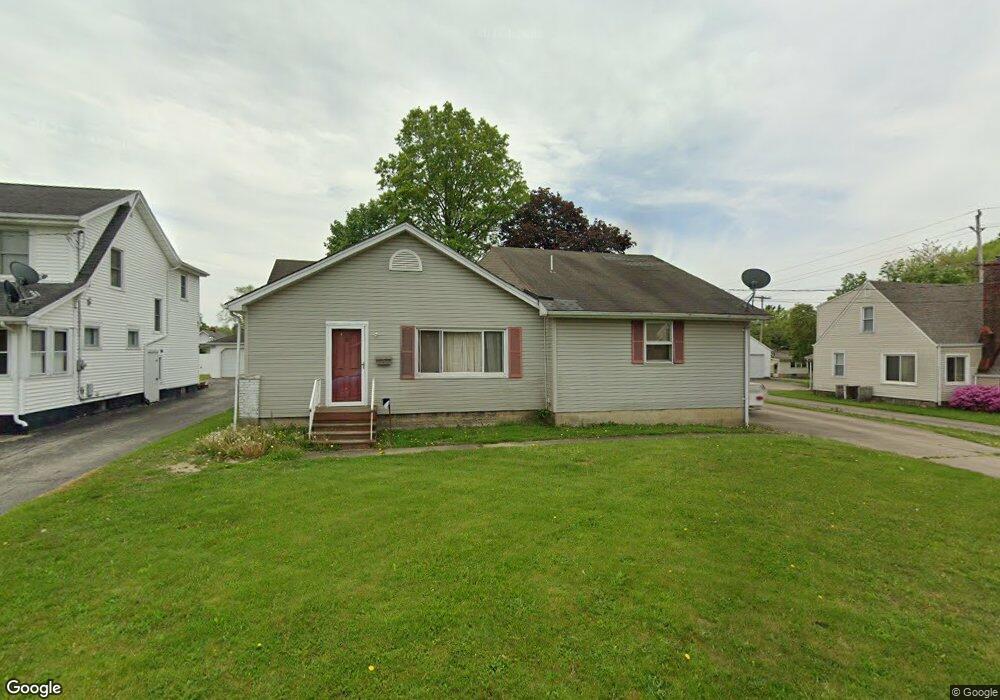
This home is located at 1515 Clark St, Niles, OH 44446 and is currently estimated at $180,228, approximately $82 per square foot. 1515 Clark St is a home located in Trumbull County with nearby schools including Niles Primary School, Niles Intermediate School, and Niles Middle School.
Ownership History
Date
Name
Owned For
Owner Type
Purchase Details
Closed on
Sep 23, 2010
Sold by
Newbrough John A and Newbrough Shirley
Bought by
Newbrough Gary E
Current Estimated Value
Home Financials for this Owner
Home Financials are based on the most recent Mortgage that was taken out on this home.
Original Mortgage
$73,600
Outstanding Balance
$24,854
Interest Rate
4.42%
Mortgage Type
New Conventional
Estimated Equity
$155,374
Purchase Details
Closed on
May 16, 2002
Sold by
Newbrough Gary and Newbrough Kathy
Bought by
Newbrough John
Purchase Details
Closed on
Oct 10, 1997
Sold by
Neatrour Frederick C
Bought by
Preston Jeffrey A and Preston Stephanie A
Home Financials for this Owner
Home Financials are based on the most recent Mortgage that was taken out on this home.
Original Mortgage
$92,025
Interest Rate
7.7%
Purchase Details
Closed on
Jan 1, 1990
Bought by
Frederick C Neatrour
Create a Home Valuation Report for This Property
The Home Valuation Report is an in-depth analysis detailing your home's value as well as a comparison with similar homes in the area
Home Values in the Area
Average Home Value in this Area
Purchase History
| Date | Buyer | Sale Price | Title Company |
|---|---|---|---|
| Newbrough Gary E | $92,000 | American Land Title Agency I | |
| Newbrough John | $122,000 | -- | |
| Preston Jeffrey A | $100,000 | -- | |
| Frederick C Neatrour | -- | -- |
Source: Public Records
Mortgage History
| Date | Status | Borrower | Loan Amount |
|---|---|---|---|
| Open | Newbrough Gary E | $73,600 | |
| Previous Owner | Preston Jeffrey A | $92,025 |
Source: Public Records
Tax History Compared to Growth
Tax History
| Year | Tax Paid | Tax Assessment Tax Assessment Total Assessment is a certain percentage of the fair market value that is determined by local assessors to be the total taxable value of land and additions on the property. | Land | Improvement |
|---|---|---|---|---|
| 2024 | $1,650 | $39,560 | $2,560 | $37,000 |
| 2023 | $1,650 | $39,560 | $2,560 | $37,000 |
| 2022 | $1,258 | $25,770 | $2,560 | $23,210 |
| 2021 | $1,322 | $25,770 | $2,560 | $23,210 |
| 2020 | $1,334 | $25,770 | $2,560 | $23,210 |
| 2019 | $1,401 | $25,770 | $2,560 | $23,210 |
| 2018 | $1,397 | $25,770 | $2,560 | $23,210 |
| 2017 | $1,389 | $25,770 | $2,560 | $23,210 |
| 2016 | $1,423 | $26,150 | $2,560 | $23,590 |
| 2015 | $1,407 | $26,150 | $2,560 | $23,590 |
| 2014 | $1,412 | $26,150 | $2,560 | $23,590 |
| 2013 | $1,503 | $29,370 | $2,560 | $26,810 |
Source: Public Records
Map
Nearby Homes
- 352 N Rhodes Ave
- 340 Mcevoy Ct
- 126 S Rhodes Ave
- 107 Hogarth Ave
- 1804 Stepney St
- 21 Summit Ave
- 1919 Carnegie Heights Dr
- 364 Hogarth Ave
- 311 High Ave
- 29 S Bentley Ave
- 839 Robbins Ave
- 404 N Bentley Ave
- 820 Hartzell Ave
- 504 High Ave
- 17 Belmont Ave
- 39 Belmont Ave
- 733 N Bentley Ave
- 2213 N Glenwood Ave
- 737 N Bentley Ave
- 0 Summit