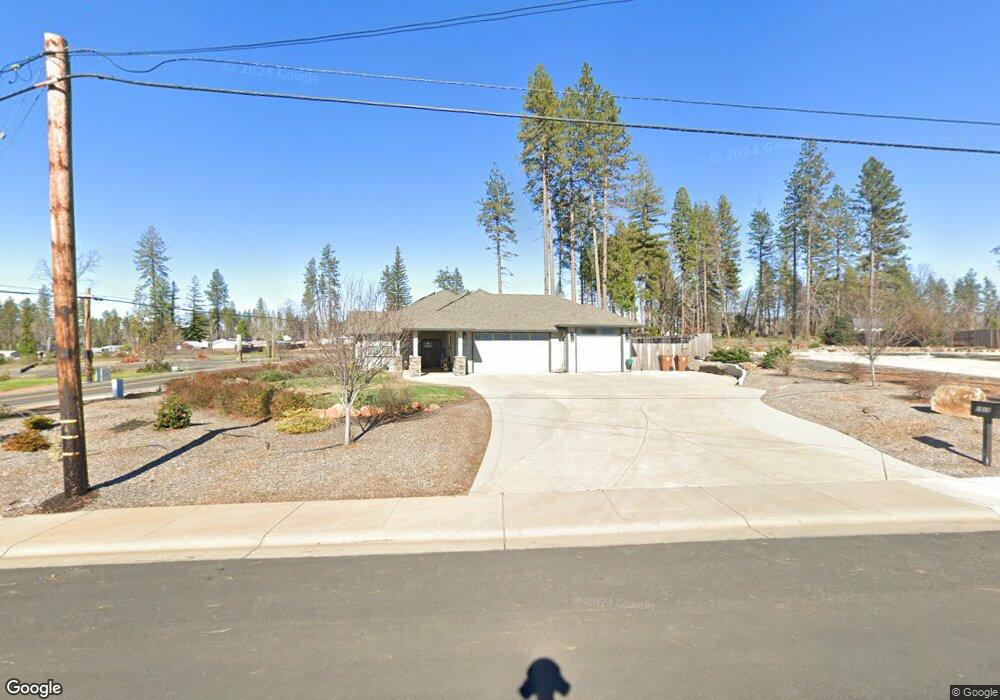
1515 Elliott Rd Paradise, CA 95969
Estimated Value: $481,000 - $805,000
4
Beds
3
Baths
2,162
Sq Ft
$261/Sq Ft
Est. Value
About This Home
This home is located at 1515 Elliott Rd, Paradise, CA 95969 and is currently estimated at $565,215, approximately $261 per square foot. 1515 Elliott Rd is a home with nearby schools including Ponderosa Elementary School, Paradise Junior High School, and Paradise Senior High School.
Ownership History
Date
Name
Owned For
Owner Type
Purchase Details
Closed on
Feb 2, 2017
Sold by
Anderson Builders Corporation
Bought by
Bibber Daniel D and Vanbibber Kimberly Van
Current Estimated Value
Home Financials for this Owner
Home Financials are based on the most recent Mortgage that was taken out on this home.
Original Mortgage
$180,000
Outstanding Balance
$148,698
Interest Rate
4.12%
Mortgage Type
New Conventional
Estimated Equity
$416,517
Purchase Details
Closed on
Dec 29, 2016
Sold by
Anderson Land & Investment Co Lp
Bought by
Anderson Builders Corp
Home Financials for this Owner
Home Financials are based on the most recent Mortgage that was taken out on this home.
Original Mortgage
$180,000
Outstanding Balance
$148,698
Interest Rate
4.12%
Mortgage Type
New Conventional
Estimated Equity
$416,517
Purchase Details
Closed on
Oct 15, 2013
Sold by
Rickards Investments
Bought by
Anderson Land & Investment Company Lp
Create a Home Valuation Report for This Property
The Home Valuation Report is an in-depth analysis detailing your home's value as well as a comparison with similar homes in the area
Home Values in the Area
Average Home Value in this Area
Purchase History
| Date | Buyer | Sale Price | Title Company |
|---|---|---|---|
| Bibber Daniel D | $280,000 | Mid Valley Title & Escrow Co | |
| Anderson Builders Corp | $80,000 | Mid Valley Title & Escrow Co | |
| Anderson Land & Investment Company Lp | $250,000 | Mid Valley Title |
Source: Public Records
Mortgage History
| Date | Status | Borrower | Loan Amount |
|---|---|---|---|
| Open | Bibber Daniel D | $180,000 |
Source: Public Records
Tax History Compared to Growth
Tax History
| Year | Tax Paid | Tax Assessment Tax Assessment Total Assessment is a certain percentage of the fair market value that is determined by local assessors to be the total taxable value of land and additions on the property. | Land | Improvement |
|---|---|---|---|---|
| 2025 | $5,399 | $511,254 | $104,449 | $406,805 |
| 2024 | $5,399 | $501,230 | $102,401 | $398,829 |
| 2023 | $5,397 | $491,403 | $100,394 | $391,009 |
| 2022 | $5,295 | $481,769 | $98,426 | $383,343 |
| 2021 | $5,181 | $472,324 | $96,497 | $375,827 |
| 2020 | $4,633 | $439,482 | $95,508 | $343,974 |
| 2019 | $413 | $35,000 | $35,000 | $0 |
| 2018 | $4,271 | $408,000 | $91,800 | $316,200 |
| 2017 | $3,983 | $378,502 | $63,502 | $315,000 |
| 2016 | $666 | $62,257 | $62,257 | $0 |
| 2015 | $653 | $61,322 | $61,322 | $0 |
| 2014 | $677 | $60,121 | $60,121 | $0 |
Source: Public Records
Map
Nearby Homes
- 5876 Sawmill Rd
- 1525 Elliott Rd
- 5875 Sawmill Rd
- 1500 Elliott Rd
- 1535 Elliott Rd
- 5859 Sawmill Rd
- 1495 Elliott Rd
- 1510 Elliott Rd
- 5849 Sawmill Rd
- 5851 Nielsen Dr
- 5887 Sawmill Rd
- 1487 Elliott Rd
- 1492 Elliott Rd
- 5844 Sawmill Rd
- 5911 Sawmill Rd
- 1555 Elliott Rd
- 1490 Elliott Rd
- 5845 Nielsen Dr
- 5890 Hazel Way
- 5847 Sawmill Rd