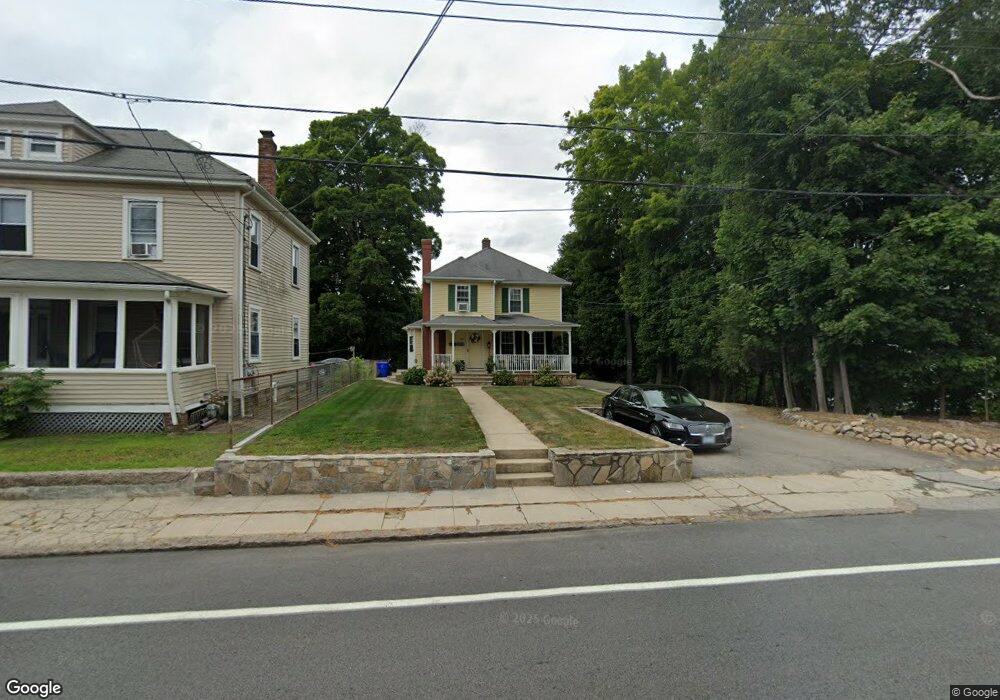
1515 Main St West Warwick, RI 02893
Centreville NeighborhoodEstimated Value: $404,000 - $451,000
4
Beds
2
Baths
1,806
Sq Ft
$238/Sq Ft
Est. Value
About This Home
This home is located at 1515 Main St, West Warwick, RI 02893 and is currently estimated at $430,490, approximately $238 per square foot. 1515 Main St is a home located in Kent County with nearby schools including West Warwick High School.
Ownership History
Date
Name
Owned For
Owner Type
Purchase Details
Closed on
Jul 8, 2020
Sold by
Mota Linda M
Bought by
Mota Linda M
Current Estimated Value
Home Financials for this Owner
Home Financials are based on the most recent Mortgage that was taken out on this home.
Original Mortgage
$144,000
Outstanding Balance
$114,097
Interest Rate
3.2%
Mortgage Type
New Conventional
Estimated Equity
$316,393
Purchase Details
Closed on
May 14, 2012
Sold by
Gizzarelli Michael T
Bought by
Gizzarelli Linda M
Purchase Details
Closed on
Jul 1, 1998
Sold by
Farias Edward and Paliotta Edwina
Bought by
Arruda Antonio J and Arruda Linda
Create a Home Valuation Report for This Property
The Home Valuation Report is an in-depth analysis detailing your home's value as well as a comparison with similar homes in the area
Home Values in the Area
Average Home Value in this Area
Purchase History
| Date | Buyer | Sale Price | Title Company |
|---|---|---|---|
| Mota Linda M | -- | None Available | |
| Gizzarelli Linda M | -- | -- | |
| Arruda Antonio J | $85,000 | -- |
Source: Public Records
Mortgage History
| Date | Status | Borrower | Loan Amount |
|---|---|---|---|
| Open | Mota Linda M | $144,000 | |
| Previous Owner | Arruda Antonio J | $156,800 | |
| Previous Owner | Arruda Antonio J | $163,000 | |
| Previous Owner | Arruda Antonio J | $126,000 |
Source: Public Records
Tax History Compared to Growth
Tax History
| Year | Tax Paid | Tax Assessment Tax Assessment Total Assessment is a certain percentage of the fair market value that is determined by local assessors to be the total taxable value of land and additions on the property. | Land | Improvement |
|---|---|---|---|---|
| 2025 | $5,324 | $372,600 | $84,000 | $288,600 |
| 2024 | $4,699 | $251,400 | $53,300 | $198,100 |
| 2023 | $4,606 | $251,400 | $53,300 | $198,100 |
| 2022 | $4,535 | $251,400 | $53,300 | $198,100 |
| 2021 | $3,949 | $171,700 | $43,800 | $127,900 |
| 2020 | $3,949 | $171,700 | $43,800 | $127,900 |
| 2019 | $5,034 | $171,700 | $43,800 | $127,900 |
| 2018 | $3,660 | $138,600 | $41,200 | $97,400 |
| 2017 | $3,647 | $138,600 | $41,200 | $97,400 |
| 2016 | $3,581 | $138,600 | $41,200 | $97,400 |
| 2015 | $3,455 | $133,100 | $41,200 | $91,900 |
| 2014 | $3,379 | $133,100 | $41,200 | $91,900 |
Source: Public Records
Map
Nearby Homes
- 38 New London Ave
- 54 Arthur St
- 3 June Ct
- 5 Cottage St
- 39 Matteson Ave
- 34 Buckley Ave
- 25 School St
- 1 Leona Ct
- 3 Leona Ct
- 12 Earl St
- 2 Teresa Ann Crossing
- 8 Teresa Ann Crossing
- 4 Teresa Ann Crossing
- 94 Cowesett Ave Unit 8
- 6 Teresa Ann Crossing
- 40 Roberts St
- 325 Washington St Unit 3
- 16 Ontario St
- 15 Hope Ct
- 1 Ritchotte Ct