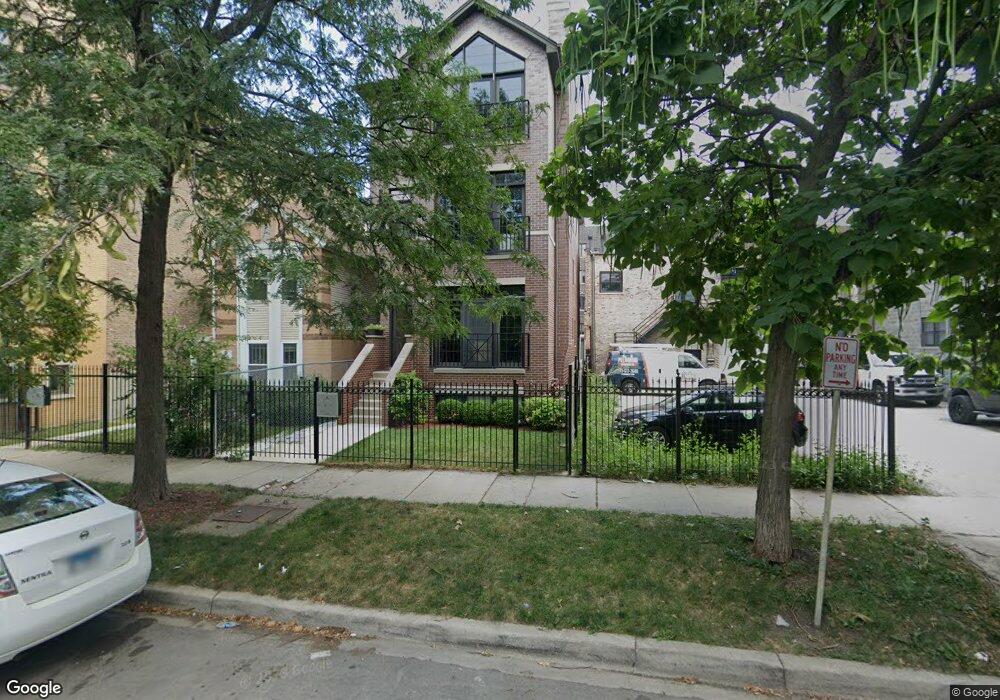
1515 N Artesian Ave Unit 3 Chicago, IL 60622
Wicker Park NeighborhoodEstimated Value: $420,446 - $579,000
2
Beds
2
Baths
5,600
Sq Ft
$88/Sq Ft
Est. Value
About This Home
This home is located at 1515 N Artesian Ave Unit 3, Chicago, IL 60622 and is currently estimated at $492,362, approximately $87 per square foot. 1515 N Artesian Ave Unit 3 is a home located in Cook County with nearby schools including José de Diego Community Academy, Clemente Community Academy High School, and Erie Elementary Charter School.
Ownership History
Date
Name
Owned For
Owner Type
Purchase Details
Closed on
Dec 3, 2012
Sold by
Chalupa Dennis and Chalupa Louise
Bought by
Chalupa Kristen
Current Estimated Value
Purchase Details
Closed on
Sep 12, 2009
Sold by
Chalupa Dennis and Chalupa Louise
Bought by
Chalupa Dennis and Chalupa Louise
Purchase Details
Closed on
Aug 15, 2008
Sold by
Wicker Park Place Llc
Bought by
Chalupa Dennis and Chalupa Louise
Home Financials for this Owner
Home Financials are based on the most recent Mortgage that was taken out on this home.
Original Mortgage
$260,000
Outstanding Balance
$170,477
Interest Rate
6.31%
Mortgage Type
Unknown
Estimated Equity
$321,885
Purchase Details
Closed on
Oct 24, 2006
Sold by
City Of Chicago
Bought by
Wicker Park Place Llc
Home Financials for this Owner
Home Financials are based on the most recent Mortgage that was taken out on this home.
Original Mortgage
$951,800
Interest Rate
6.5%
Mortgage Type
Construction
Create a Home Valuation Report for This Property
The Home Valuation Report is an in-depth analysis detailing your home's value as well as a comparison with similar homes in the area
Home Values in the Area
Average Home Value in this Area
Purchase History
| Date | Buyer | Sale Price | Title Company |
|---|---|---|---|
| Chalupa Kristen | -- | Old Republic National Title | |
| Chalupa Dennis | -- | None Available | |
| Chalupa Dennis | $325,000 | Multiple | |
| Wicker Park Place Llc | $245,000 | None Available |
Source: Public Records
Mortgage History
| Date | Status | Borrower | Loan Amount |
|---|---|---|---|
| Open | Chalupa Dennis | $260,000 | |
| Previous Owner | Wicker Park Place Llc | $951,800 |
Source: Public Records
Tax History Compared to Growth
Tax History
| Year | Tax Paid | Tax Assessment Tax Assessment Total Assessment is a certain percentage of the fair market value that is determined by local assessors to be the total taxable value of land and additions on the property. | Land | Improvement |
|---|---|---|---|---|
| 2024 | $4,974 | $26,152 | $4,391 | $21,761 |
| 2023 | $4,813 | $26,818 | $1,999 | $24,819 |
| 2022 | $4,813 | $26,818 | $1,999 | $24,819 |
| 2021 | $4,723 | $26,818 | $1,999 | $24,819 |
| 2020 | $4,838 | $24,818 | $1,999 | $22,819 |
| 2019 | $4,826 | $27,449 | $1,999 | $25,450 |
| 2018 | $4,743 | $27,449 | $1,999 | $25,450 |
| 2017 | $4,651 | $24,979 | $1,764 | $23,215 |
| 2016 | $4,503 | $24,979 | $1,764 | $23,215 |
| 2015 | $4,097 | $24,979 | $1,764 | $23,215 |
| 2014 | $2,728 | $17,271 | $1,587 | $15,684 |
| 2013 | $2,663 | $17,271 | $1,587 | $15,684 |
Source: Public Records
Map
Nearby Homes
- 1522 N Western Ave Unit 4
- 1504 N Western Ave Unit 2N
- 1527 N Western Ave
- 1456 N Artesian Ave Unit 3R
- 1456 N Artesian Ave Unit 1R
- 1456 N Artesian Ave Unit 3F
- 1540 N Claremont Ave Unit 1W
- 1456 N Campbell Ave
- 1431 N Artesian Ave Unit 1
- 1541 N Maplewood Ave
- 1621 N Campbell Ave Unit 1
- 1534 N Maplewood Ave
- 1406 N Artesian Ave
- 1431 N Maplewood Ave
- 1618 N Oakley Ave Unit 2S
- 1653 N Campbell Ave
- 1415 N Maplewood Ave
- 2544 W North Ave Unit 3D
- 1355 N Western Ave Unit 2A
- 1355 N Western Ave Unit 4D
- 1515 N Artesian Ave Unit 2
- 1515 N Artesian Ave Unit 1
- 1511 N Artesian Ave
- 1521 N Artesian Ave Unit 1
- 1521 N Artesian Ave Unit 3
- 1521 N Artesian Ave Unit 2
- 1523 N Artesian Ave Unit 201
- 1523 N Artesian Ave Unit 301
- 1523 N Artesian Ave Unit 101
- 1505 N Artesian Ave Unit 1
- 1505 N Artesian Ave Unit 15052
- 1505 N Artesian Ave Unit 15051
- 1505 N Artesian Ave Unit 15053
- 1505 N Artesian Ave Unit 3
- 1518 N Western Ave
- 1525 N Artesian Ave
- 1525 N Artesian Ave Unit 2
- 1525 N Artesian Ave Unit 1
- 1512 N Western Ave
- 1510 N Western Ave Unit 4N