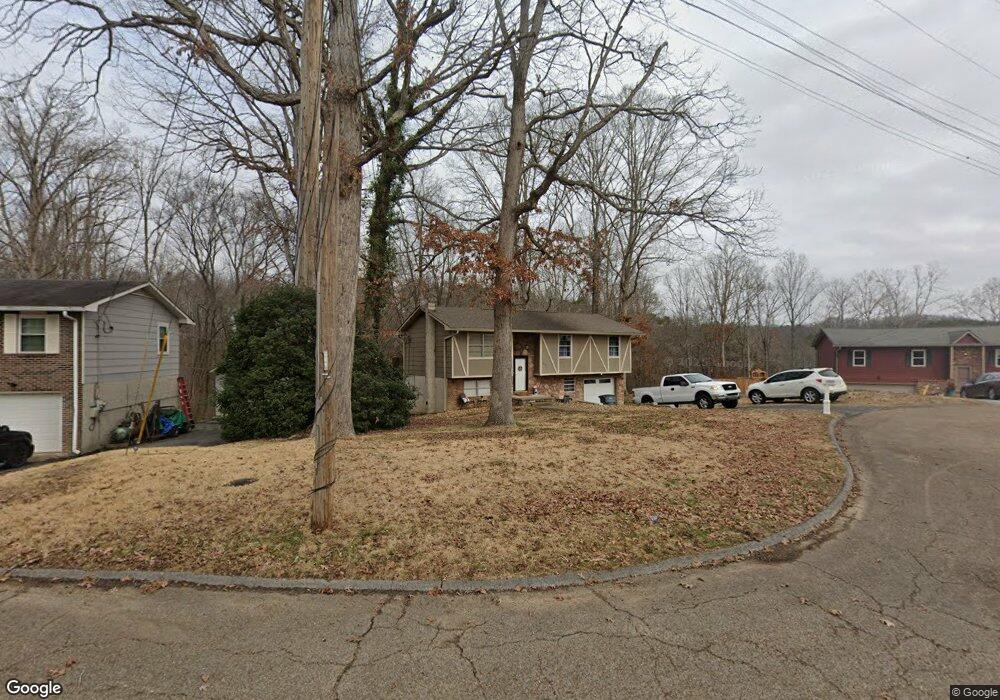
1515 N Winer Dr Soddy Daisy, TN 37379
Estimated Value: $267,000 - $319,000
3
Beds
2
Baths
1,400
Sq Ft
$204/Sq Ft
Est. Value
About This Home
This home is located at 1515 N Winer Dr, Soddy Daisy, TN 37379 and is currently estimated at $286,271, approximately $204 per square foot. 1515 N Winer Dr is a home located in Hamilton County with nearby schools including McConnell Elementary School and Loftis Middle School.
Ownership History
Date
Name
Owned For
Owner Type
Purchase Details
Closed on
Jun 29, 2021
Sold by
Cabe Amy and Cabe Amy Jennifer
Bought by
Cabe John Michael
Current Estimated Value
Home Financials for this Owner
Home Financials are based on the most recent Mortgage that was taken out on this home.
Original Mortgage
$148,000
Outstanding Balance
$134,287
Interest Rate
2.9%
Mortgage Type
New Conventional
Estimated Equity
$151,984
Purchase Details
Closed on
May 31, 2001
Sold by
Larry Roddy Robert and Larry Cheryl P
Bought by
Cabe John Michael and Cabe Amy
Home Financials for this Owner
Home Financials are based on the most recent Mortgage that was taken out on this home.
Original Mortgage
$84,333
Interest Rate
7.11%
Mortgage Type
FHA
Purchase Details
Closed on
Aug 16, 1999
Sold by
Devivo Cheryl P and Devivo Cheryl P
Bought by
Roddy Robert Larry and Roddy Cheryl P
Purchase Details
Closed on
Sep 22, 1995
Bought by
Devivo Cheryl P
Create a Home Valuation Report for This Property
The Home Valuation Report is an in-depth analysis detailing your home's value as well as a comparison with similar homes in the area
Home Values in the Area
Average Home Value in this Area
Purchase History
| Date | Buyer | Sale Price | Title Company |
|---|---|---|---|
| Cabe John Michael | -- | First Title | |
| Cabe John Michael | $85,000 | First Title | |
| Roddy Robert Larry | -- | -- | |
| Devivo Cheryl P | $67,500 | -- |
Source: Public Records
Mortgage History
| Date | Status | Borrower | Loan Amount |
|---|---|---|---|
| Open | Cabe John Michael | $148,000 | |
| Closed | Cabe John Michael | $84,333 |
Source: Public Records
Tax History Compared to Growth
Tax History
| Year | Tax Paid | Tax Assessment Tax Assessment Total Assessment is a certain percentage of the fair market value that is determined by local assessors to be the total taxable value of land and additions on the property. | Land | Improvement |
|---|---|---|---|---|
| 2024 | $858 | $38,350 | $0 | $0 |
| 2023 | $867 | $38,350 | $0 | $0 |
| 2022 | $867 | $38,350 | $0 | $0 |
| 2021 | $867 | $38,350 | $0 | $0 |
| 2020 | $713 | $25,475 | $0 | $0 |
| 2019 | $713 | $25,475 | $0 | $0 |
| 2018 | $713 | $25,475 | $0 | $0 |
| 2017 | $713 | $25,475 | $0 | $0 |
| 2016 | $671 | $0 | $0 | $0 |
| 2015 | $671 | $23,950 | $0 | $0 |
| 2014 | $671 | $0 | $0 | $0 |
Source: Public Records
Map
Nearby Homes
- 1476 Alex Ln
- 9051 Mandy Ln
- 9068 Polan Ln
- 9059 Dallas Hollow Rd
- 1446 Alex Ln
- 1442 Alex Ln
- 1568 Dallas Lake Rd
- 1814 Dallas Lake Rd
- 1806 Dallas Lake Rd
- 8979 Hale Rd
- 8602 Kensley Ln
- 8642 Kensley Ln
- 8647 Kensley Ln
- 9226 Sugar Pine Dr
- 8520 Kensley Ln
- 8517 Kensley Ln
- 1876 N Prairie Cir
- 10 Storyvale Ln
- 8900 Wellthor Cir
- 8549 Demars Ln
- 1513 N Winer Dr
- 1517 N Winer Dr
- 1509 N Winer Dr
- 1516 N Winer Dr
- 1519 N Winer Dr
- 1512 N Winer Dr
- 1524 N Winer Dr
- 1505 N Winer Dr
- 1521 N Winer Dr
- 1523 N Winer Dr
- 1508 N Winer Dr
- 1501 N Winer Dr
- 1528 N Winer Dr
- 1525 N Winer Dr
- 1506 N Winer Dr
- 1435 N Winer Dr
- 1527 N Winer Dr
- 1433 N Winer Dr
- 1504 N Winer Dr
- 1519 Marrick Dr