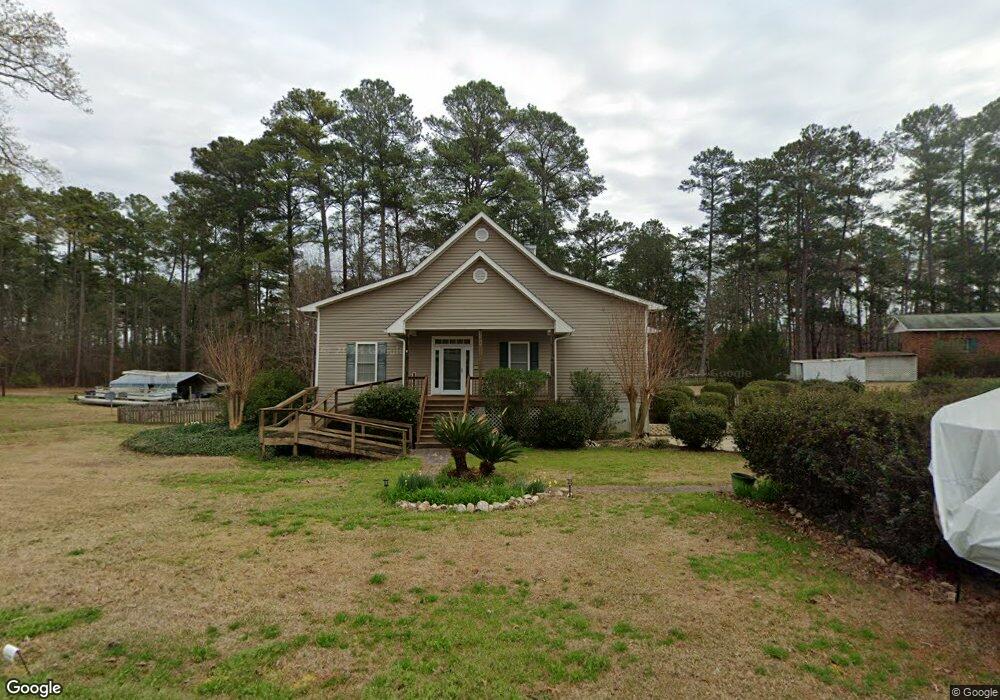
1515 Pleasant View Cir Lincolnton, GA 30817
Estimated Value: $435,000 - $569,000
3
Beds
2
Baths
2,058
Sq Ft
$246/Sq Ft
Est. Value
About This Home
This home is located at 1515 Pleasant View Cir, Lincolnton, GA 30817 and is currently estimated at $506,707, approximately $246 per square foot. 1515 Pleasant View Cir is a home located in Lincoln County with nearby schools including Lincoln County Elementary School, Lincoln County Middle School, and Lincoln County High School.
Ownership History
Date
Name
Owned For
Owner Type
Purchase Details
Closed on
Dec 3, 2009
Sold by
Vizvary Paul
Bought by
Paul J Vizvary Living Trust
Current Estimated Value
Purchase Details
Closed on
Jul 29, 2009
Sold by
Vizvary Emil C
Bought by
Vizvary Paul J
Purchase Details
Closed on
Feb 27, 2007
Sold by
Newman Jerry M
Bought by
Vizvary Emil C
Purchase Details
Closed on
Jul 17, 2003
Sold by
Newman Jerry W
Bought by
Newman Jerry M and Daly Twila D
Purchase Details
Closed on
Dec 12, 2002
Sold by
Jackson Marion L
Bought by
Newman Jerry W
Purchase Details
Closed on
Jul 23, 1990
Sold by
Cave Ernest C
Bought by
Jackson Marion L and Jackson Betty
Purchase Details
Closed on
Aug 3, 1987
Sold by
Williams Doris T
Bought by
Cave Ernest C
Purchase Details
Closed on
Apr 21, 1983
Sold by
Cave Ernest
Bought by
Williams Doris T
Purchase Details
Closed on
Sep 28, 1970
Sold by
Scalf Ernest and Scalf Frances
Bought by
Cave Ernest
Create a Home Valuation Report for This Property
The Home Valuation Report is an in-depth analysis detailing your home's value as well as a comparison with similar homes in the area
Home Values in the Area
Average Home Value in this Area
Purchase History
| Date | Buyer | Sale Price | Title Company |
|---|---|---|---|
| Paul J Vizvary Living Trust | -- | -- | |
| Vizvary Paul J | -- | -- | |
| Vizvary Emil C | $490,000 | -- | |
| Newman Jerry M | -- | -- | |
| Newman Jerry W | $45,000 | -- | |
| Jackson Marion L | $8,000 | -- | |
| Cave Ernest C | $7,500 | -- | |
| Williams Doris T | $4,000 | -- | |
| Cave Ernest | $3,000 | -- |
Source: Public Records
Tax History Compared to Growth
Tax History
| Year | Tax Paid | Tax Assessment Tax Assessment Total Assessment is a certain percentage of the fair market value that is determined by local assessors to be the total taxable value of land and additions on the property. | Land | Improvement |
|---|---|---|---|---|
| 2025 | $4,377 | $167,280 | $37,400 | $129,880 |
| 2024 | $4,356 | $167,280 | $37,400 | $129,880 |
| 2023 | $3,497 | $133,000 | $37,400 | $95,600 |
| 2022 | $3,532 | $133,000 | $37,400 | $95,600 |
| 2021 | $4,429 | $152,880 | $37,400 | $115,480 |
| 2020 | $3,802 | $111,520 | $37,400 | $74,120 |
| 2019 | $3,816 | $111,520 | $37,400 | $74,120 |
| 2018 | $3,505 | $111,520 | $37,400 | $74,120 |
| 2017 | $3,689 | $117,380 | $40,800 | $76,580 |
| 2016 | $3,835 | $117,380 | $40,800 | $76,580 |
| 2015 | -- | $117,380 | $40,800 | $76,580 |
| 2014 | -- | $117,380 | $40,800 | $76,580 |
| 2013 | -- | $150,620 | $60,000 | $90,620 |
Source: Public Records
Map
Nearby Homes
- 1063 Fleming Lk Ct
- 1063 Fleming Lake Ct
- 1080 Serenity Pointe Dr
- 1164 Sally Ann Ct
- 1203 Price Reese Rd
- 1016 Hidden Lake Ct
- 1250 Mosley Rd
- 1025 Plantation Ln
- 1179 Lakeside Dr
- LOT 22 Plantation Point Rd
- 0 Sturkey Ferry Rd Unit 24022341
- 1085 Lake Dr
- 1051 Lake Dr
- 00 Bonner Rd
- 9-3 Long Cove
- 1-3 Long Cove Dr
- 6-3 Long Cove Dr
- 8-3 Long Cove Dr
- 5-3 Long Cove Dr
- 4-3 Long Cove Dr
- 1539 Pleasant View Cir
- 1022 Beaver Run S
- 1010 Beaver Run S
- 31 Pleasantview Cir
- 0 Pleasantview Cir
- 1128 Pleasant View Cir
- 1492 Pleasantview Cir
- 1524 Pleasant View Cir
- 1495 Pleasantview Cir
- 1309 Pleasant
- 1492 Pleasant View Cir
- 1144 Pleasant View Cir
- 1559 Pleasant View Cir
- 1556 Pleasant View Cir
- 1498 Pleasant View Cir
- 1133 Pleasant View Cir
- 1130 W Lake Dr
- 1149 Pleasant View Cir
- 1084 Pleasant View Cir
- 1478 Pleasant View Cir