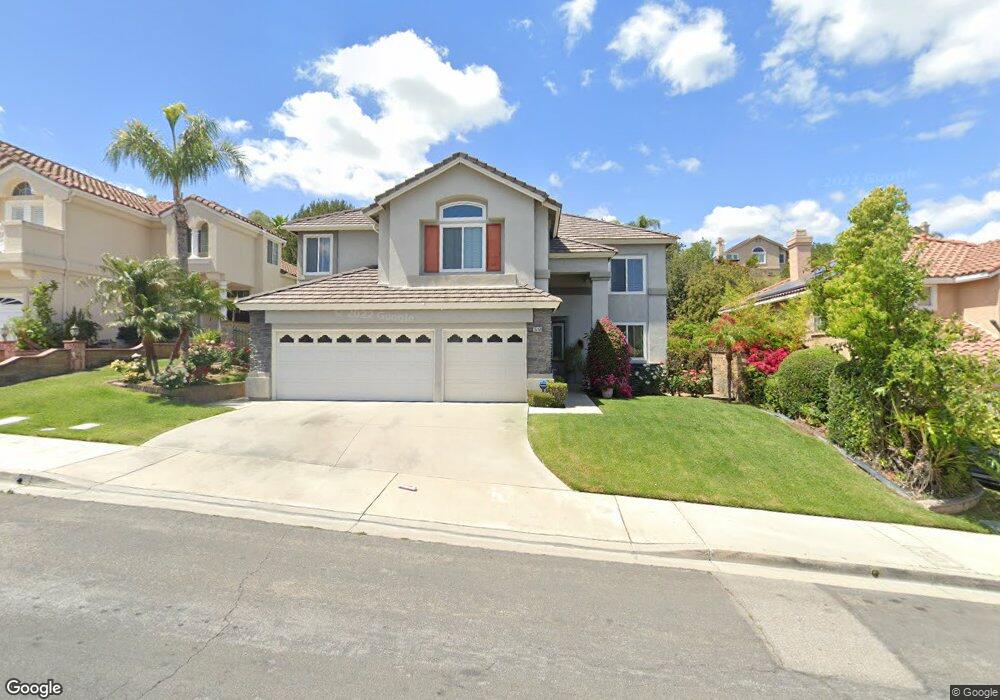
15150 Via Maravilla Chino Hills, CA 91709
North Chino Hills NeighborhoodEstimated Value: $1,570,000 - $1,821,000
6
Beds
4
Baths
3,611
Sq Ft
$456/Sq Ft
Est. Value
About This Home
This home is located at 15150 Via Maravilla, Chino Hills, CA 91709 and is currently estimated at $1,644,998, approximately $455 per square foot. 15150 Via Maravilla is a home located in San Bernardino County with nearby schools including Hidden Trails Elementary School, Canyon Hills Junior High School, and Ruben S. Ayala High School.
Ownership History
Date
Name
Owned For
Owner Type
Purchase Details
Closed on
Oct 29, 2010
Sold by
Mukerji Ananta P
Bought by
Mukerji Ananta Prasanna and Mukherjee Kumkum
Current Estimated Value
Purchase Details
Closed on
Nov 8, 1996
Sold by
Inaba Lee Morgan and Inaba Joyce
Bought by
Mukerji Ananta P and Mukherjee Kumkum
Home Financials for this Owner
Home Financials are based on the most recent Mortgage that was taken out on this home.
Original Mortgage
$242,000
Outstanding Balance
$23,366
Interest Rate
7.86%
Estimated Equity
$1,621,632
Purchase Details
Closed on
May 24, 1996
Sold by
Inaba Lee Morgan
Bought by
Inaba Lee Morgan and Inaba Lee Joyce
Purchase Details
Closed on
Jun 22, 1994
Sold by
M J Brock & Sons Inc
Bought by
Inaba Lee Morgan and Inaba Lee Joyce
Home Financials for this Owner
Home Financials are based on the most recent Mortgage that was taken out on this home.
Original Mortgage
$285,873
Interest Rate
6.15%
Create a Home Valuation Report for This Property
The Home Valuation Report is an in-depth analysis detailing your home's value as well as a comparison with similar homes in the area
Home Values in the Area
Average Home Value in this Area
Purchase History
| Date | Buyer | Sale Price | Title Company |
|---|---|---|---|
| Mukerji Ananta Prasanna | -- | None Available | |
| Mukerji Ananta P | $302,500 | American Title | |
| Inaba Lee Morgan | -- | American Title | |
| Inaba Lee Morgan | $318,000 | First American Title Ins Co |
Source: Public Records
Mortgage History
| Date | Status | Borrower | Loan Amount |
|---|---|---|---|
| Open | Mukerji Ananta P | $242,000 | |
| Previous Owner | Inaba Lee Morgan | $285,873 |
Source: Public Records
Tax History Compared to Growth
Tax History
| Year | Tax Paid | Tax Assessment Tax Assessment Total Assessment is a certain percentage of the fair market value that is determined by local assessors to be the total taxable value of land and additions on the property. | Land | Improvement |
|---|---|---|---|---|
| 2025 | $6,389 | $549,735 | $162,867 | $386,868 |
| 2024 | $6,389 | $538,956 | $159,674 | $379,282 |
| 2023 | $6,224 | $528,388 | $156,543 | $371,845 |
| 2022 | $6,189 | $518,028 | $153,474 | $364,554 |
| 2021 | $6,077 | $507,871 | $150,465 | $357,406 |
| 2020 | $6,004 | $502,663 | $148,922 | $353,741 |
| 2019 | $6,518 | $492,807 | $146,002 | $346,805 |
| 2018 | $6,385 | $483,144 | $143,139 | $340,005 |
| 2017 | $6,278 | $473,670 | $140,332 | $333,338 |
| 2016 | $5,924 | $464,382 | $137,580 | $326,802 |
| 2015 | $5,815 | $457,406 | $135,513 | $321,893 |
| 2014 | $5,708 | $448,446 | $132,858 | $315,588 |
Source: Public Records
Map
Nearby Homes
- 15050 Avenida de Las Flores
- 2702 Avenida Marguerite
- 3027 Spyglass Ct
- 15358 Morningside Dr
- 2516 Sundial Dr Unit B
- 15075 Avenida Del Monte
- 3107 Morningside Dr
- 2432 Moon Dust Dr Unit B
- 15429 Turquoise Cir N
- 14748 Moon Crest Ln Unit E
- 14726 Moon Crest Ln Unit E
- 0 Valle Vista Dr
- 14797 Maplewood Dr
- 15030 Camino Arroyo
- 2891 Galloping Hills Rd
- 3159 Morningfield Dr
- 3167 Morningfield Dr
- 15413 Oakgrove Ct
- 2460 Windmill Creek Rd
- 15770 Pistachio St
- 15158 Via Maravilla
- 15142 Via Maravilla
- 15166 Via Maravilla
- 15134 Via Maravilla
- 15071 Avenida Del Rio
- 15077 Avenida Del Rio
- 15065 Avenida Del Rio
- 15174 Via Maravilla
- 15083 Avenida Del Rio
- 15059 Avenida Del Rio
- 15126 Via Maravilla
- 15153 Via Maravilla
- 15145 Via Maravilla
- 15161 Via Maravilla
- 15053 Avenida Del Rio
- 15137 Via Maravilla
- 15182 Via Maravilla
- 15089 Avenida Del Rio
- 15169 Via Maravilla
- 15118 Via Maravilla