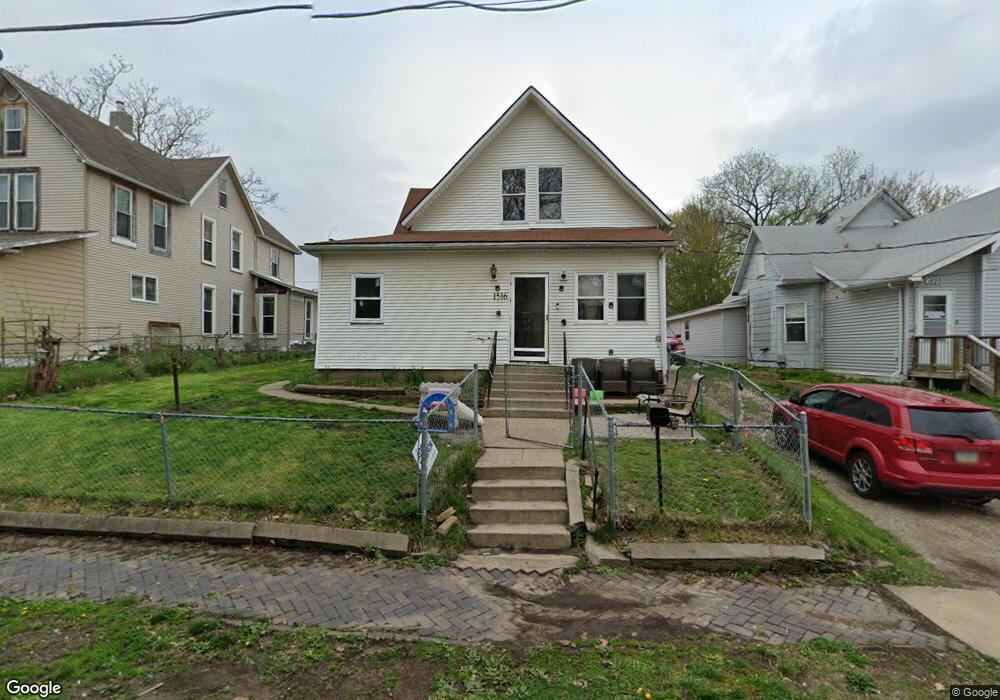
1516 10th St Des Moines, IA 50314
King Irving NeighborhoodEstimated Value: $141,914 - $237,000
4
Beds
2
Baths
1,334
Sq Ft
$130/Sq Ft
Est. Value
About This Home
This home is located at 1516 10th St, Des Moines, IA 50314 and is currently estimated at $173,229, approximately $129 per square foot. 1516 10th St is a home located in Polk County with nearby schools including Moulton Elementary School, Harding Middle School, and North High School.
Ownership History
Date
Name
Owned For
Owner Type
Purchase Details
Closed on
Jan 27, 2022
Sold by
Charles Karuku
Bought by
Benson Falisha
Current Estimated Value
Purchase Details
Closed on
Dec 17, 2021
Sold by
Charles Karuku
Bought by
Benson Falisha
Purchase Details
Closed on
Mar 29, 2007
Sold by
Karuku Charles and Karuku Lindsey
Bought by
Benson Falishsa
Home Financials for this Owner
Home Financials are based on the most recent Mortgage that was taken out on this home.
Original Mortgage
$102,000
Interest Rate
6.25%
Mortgage Type
Seller Take Back
Purchase Details
Closed on
Jun 8, 2005
Sold by
Bunch Patricia A and Kirker Kevin Edward
Bought by
Karuku Charles and Karuku Lindsey
Home Financials for this Owner
Home Financials are based on the most recent Mortgage that was taken out on this home.
Original Mortgage
$51,500
Interest Rate
5.75%
Mortgage Type
Fannie Mae Freddie Mac
Create a Home Valuation Report for This Property
The Home Valuation Report is an in-depth analysis detailing your home's value as well as a comparison with similar homes in the area
Home Values in the Area
Average Home Value in this Area
Purchase History
| Date | Buyer | Sale Price | Title Company |
|---|---|---|---|
| Benson Falisha | $105,000 | None Listed On Document | |
| Benson Falisha | $105,000 | None Listed On Document | |
| Benson Falishsa | $105,000 | None Available | |
| Karuku Charles | $51,000 | -- |
Source: Public Records
Mortgage History
| Date | Status | Borrower | Loan Amount |
|---|---|---|---|
| Previous Owner | Benson Falishsa | $102,000 | |
| Previous Owner | Karuku Charles | $51,500 |
Source: Public Records
Tax History Compared to Growth
Tax History
| Year | Tax Paid | Tax Assessment Tax Assessment Total Assessment is a certain percentage of the fair market value that is determined by local assessors to be the total taxable value of land and additions on the property. | Land | Improvement |
|---|---|---|---|---|
| 2025 | $1,502 | $101,300 | $13,700 | $87,600 |
| 2024 | $1,502 | $86,800 | $11,700 | $75,100 |
| 2023 | $1,248 | $86,800 | $11,700 | $75,100 |
| 2022 | $1,236 | $61,800 | $8,900 | $52,900 |
| 2021 | $1,150 | $61,800 | $8,900 | $52,900 |
| 2020 | $1,190 | $54,700 | $7,900 | $46,800 |
| 2019 | $1,102 | $54,700 | $7,900 | $46,800 |
| 2018 | $1,084 | $49,500 | $7,000 | $42,500 |
| 2017 | $1,122 | $49,500 | $7,000 | $42,500 |
| 2016 | $1,088 | $50,000 | $7,000 | $43,000 |
| 2015 | $1,088 | $50,000 | $7,000 | $43,000 |
| 2014 | $970 | $45,200 | $7,000 | $38,200 |
Source: Public Records
Map
Nearby Homes