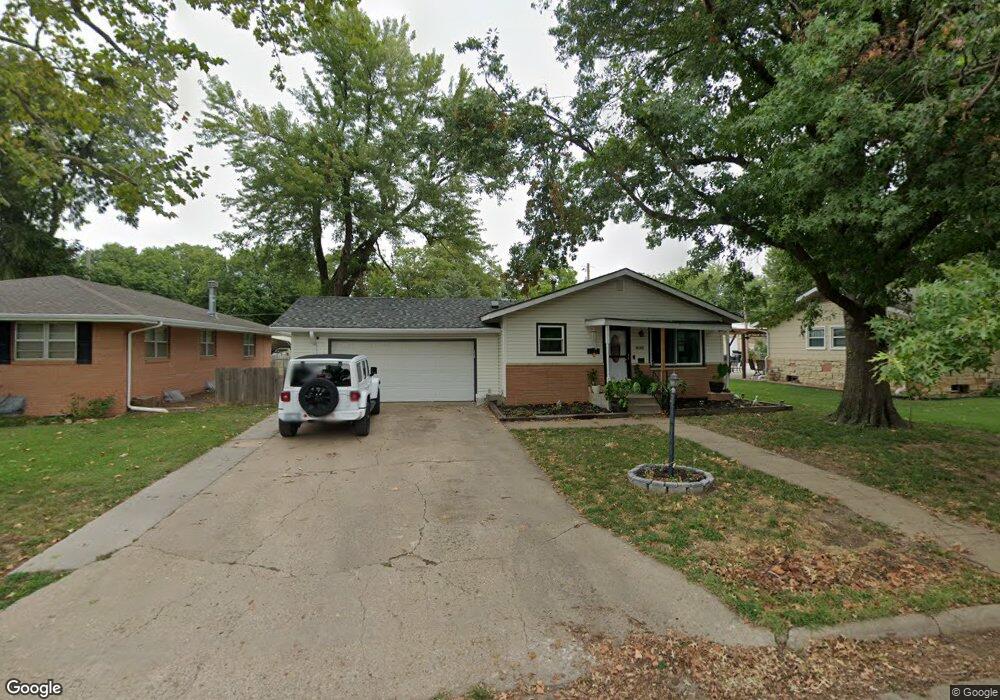
1516 E 14th Ave Winfield, KS 67156
Estimated Value: $149,000 - $178,603
3
Beds
3
Baths
2,450
Sq Ft
$66/Sq Ft
Est. Value
About This Home
This home is located at 1516 E 14th Ave, Winfield, KS 67156 and is currently estimated at $161,651, approximately $65 per square foot. 1516 E 14th Ave is a home located in Cowley County with nearby schools including Winfield High School, Trinity Lutheran School, and Holy Name Catholic School.
Ownership History
Date
Name
Owned For
Owner Type
Purchase Details
Closed on
Jan 8, 2021
Sold by
Lavender Investment Properties Llc
Bought by
Venn Steven M
Current Estimated Value
Home Financials for this Owner
Home Financials are based on the most recent Mortgage that was taken out on this home.
Original Mortgage
$107,415
Outstanding Balance
$95,851
Interest Rate
2.7%
Mortgage Type
VA
Estimated Equity
$65,800
Purchase Details
Closed on
Aug 26, 2020
Sold by
Morford David L and Morford Sharon Franz
Bought by
Lavender Investment Properties Llc
Purchase Details
Closed on
Apr 8, 2008
Sold by
Morford David L and Morford Laura M
Bought by
Morford David L and Morford Laura M
Home Financials for this Owner
Home Financials are based on the most recent Mortgage that was taken out on this home.
Original Mortgage
$118,800
Interest Rate
6.19%
Create a Home Valuation Report for This Property
The Home Valuation Report is an in-depth analysis detailing your home's value as well as a comparison with similar homes in the area
Home Values in the Area
Average Home Value in this Area
Purchase History
| Date | Buyer | Sale Price | Title Company |
|---|---|---|---|
| Venn Steven M | -- | None Available | |
| Lavender Investment Properties Llc | -- | None Available | |
| Morford David L | -- | -- |
Source: Public Records
Mortgage History
| Date | Status | Borrower | Loan Amount |
|---|---|---|---|
| Open | Venn Steven M | $107,415 | |
| Previous Owner | Morford David L | $118,800 |
Source: Public Records
Tax History
| Year | Tax Paid | Tax Assessment Tax Assessment Total Assessment is a certain percentage of the fair market value that is determined by local assessors to be the total taxable value of land and additions on the property. | Land | Improvement |
|---|---|---|---|---|
| 2025 | $1,894 | $13,242 | $1,865 | $11,377 |
| 2024 | $1,894 | $12,960 | $1,865 | $11,095 |
| 2023 | $1,892 | $11,972 | $1,740 | $10,232 |
| 2022 | $2,434 | $10,690 | $1,860 | $8,830 |
| 2021 | $2,434 | $13,820 | $1,827 | $11,993 |
| 2020 | $2,464 | $13,939 | $1,116 | $12,823 |
| 2019 | $2,498 | $14,247 | $1,153 | $13,094 |
| 2018 | $2,418 | $13,940 | $706 | $13,234 |
| 2017 | $2,405 | $13,940 | $676 | $13,264 |
| 2016 | $2,391 | $14,072 | $612 | $13,460 |
| 2015 | -- | $14,072 | $612 | $13,460 |
| 2014 | -- | $14,071 | $638 | $13,433 |
Source: Public Records
Map
Nearby Homes
- 1502 E 11th Ave
- 1301 E 11th Ave
- 1902 Booth St
- 1118 E 12th Ave
- 1204 E 11th Ave
- 1220 Elizabeth St
- 1020 E 12th Ave
- 1319 John St
- 1007 E 14th Ave
- 1118 E 10th Ave
- 918 E 15th Ave
- 915 E 15th Ave
- 19 Fleetwood Dr
- 1010 E 9th Ave
- 1110 E 8th Ave
- 901 E 8th Ave
- 702 E 12th Ave
- 1719 Maris St
- 507 Alexander St
- 1121 Harris Rd
- 1518 E 14th Ave
- 1512 E 14th Ave
- 1508 E 14th Ave
- 1515 E 13th Ave
- 1523 E 13th Ave
- 1321 Mound St
- 1315 Mound St
- 1513 E 14th Ave
- 1521 E 14th Ave
- 1507 E 13th Ave
- 1309 Mound St
- 1502 E 14th Ave
- 1403 Mound St
- 1501 E 13th Ave
- 1301 Mound St
- 1503 E 14th Ave
- 1407 Mound St
- 1419 E 13th Ave
- 1418 E 14th Ave
- 1512 E 13th Ave
Your Personal Tour Guide
Ask me questions while you tour the home.