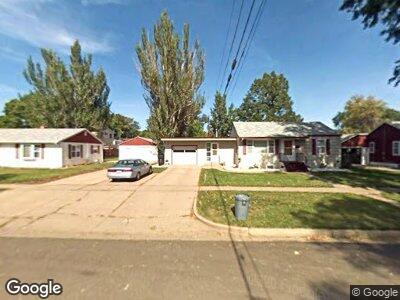
1516 E Avenue F Bismarck, ND 58501
Hillside South NeighborhoodEstimated Value: $217,000 - $244,149
3
Beds
2
Baths
972
Sq Ft
$240/Sq Ft
Est. Value
About This Home
This home is located at 1516 E Avenue F, Bismarck, ND 58501 and is currently estimated at $233,037, approximately $239 per square foot. 1516 E Avenue F is a home located in Burleigh County with nearby schools including Wachter Middle School, Legacy High School, and Saint Anne Elementary School.
Ownership History
Date
Name
Owned For
Owner Type
Purchase Details
Closed on
Jul 5, 2005
Sold by
Johnson Vivian and Johnson Vivian L
Bought by
Daniels Doris J
Current Estimated Value
Home Financials for this Owner
Home Financials are based on the most recent Mortgage that was taken out on this home.
Original Mortgage
$73,729
Interest Rate
5.75%
Mortgage Type
Future Advance Clause Open End Mortgage
Create a Home Valuation Report for This Property
The Home Valuation Report is an in-depth analysis detailing your home's value as well as a comparison with similar homes in the area
Home Values in the Area
Average Home Value in this Area
Purchase History
| Date | Buyer | Sale Price | Title Company |
|---|---|---|---|
| Daniels Doris J | -- | Nd Guaranty & Title Co |
Source: Public Records
Mortgage History
| Date | Status | Borrower | Loan Amount |
|---|---|---|---|
| Open | Daniels Doris J | $45,915 | |
| Open | Daniels Doris J | $93,800 | |
| Closed | Daniels Doris J | $25,100 | |
| Closed | Daniels Doris J | $94,500 | |
| Closed | Daniels Doris J | $73,729 |
Source: Public Records
Tax History Compared to Growth
Tax History
| Year | Tax Paid | Tax Assessment Tax Assessment Total Assessment is a certain percentage of the fair market value that is determined by local assessors to be the total taxable value of land and additions on the property. | Land | Improvement |
|---|---|---|---|---|
| 2024 | $11 | $98,900 | $20,000 | $78,900 |
| 2023 | $2,897 | $98,900 | $20,000 | $78,900 |
| 2022 | $2,234 | $88,850 | $20,000 | $68,850 |
| 2021 | $1,621 | $82,100 | $19,000 | $63,100 |
| 2020 | $1,783 | $78,550 | $19,000 | $59,550 |
| 2019 | $2,020 | $77,750 | $0 | $0 |
| 2018 | $2,020 | $77,750 | $19,000 | $58,750 |
| 2017 | $1,471 | $77,750 | $19,000 | $58,750 |
| 2016 | $1,471 | $77,750 | $14,000 | $63,750 |
| 2014 | -- | $69,200 | $0 | $0 |
Source: Public Records
Map
Nearby Homes