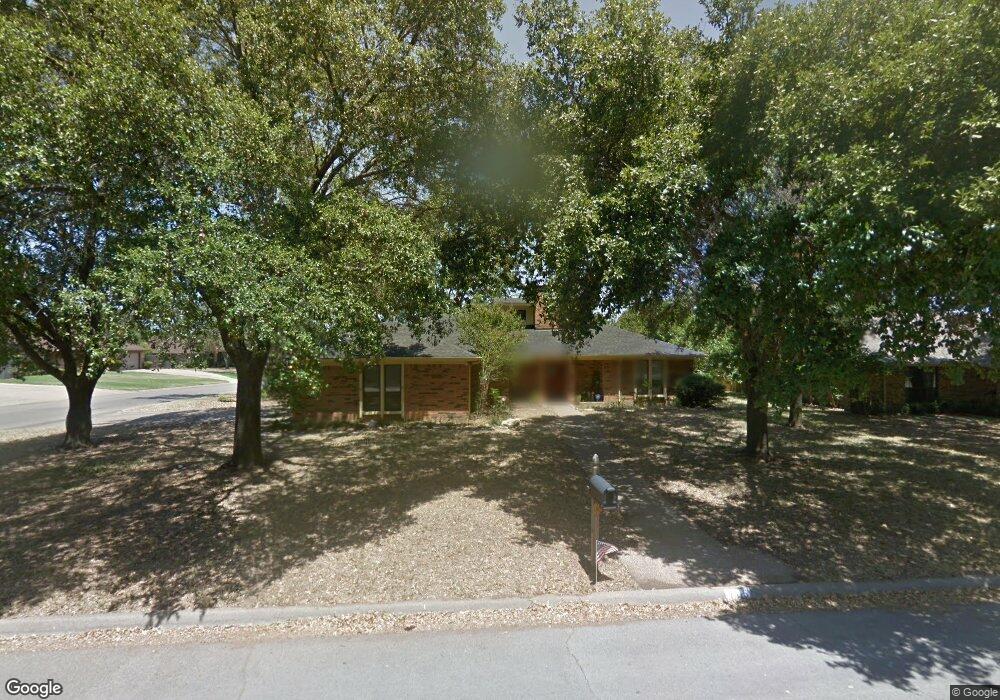
1516 Hemphill Dr Cleburne, TX 76033
Estimated Value: $304,000 - $351,000
3
Beds
2
Baths
2,032
Sq Ft
$156/Sq Ft
Est. Value
About This Home
This home is located at 1516 Hemphill Dr, Cleburne, TX 76033 and is currently estimated at $316,289, approximately $155 per square foot. 1516 Hemphill Dr is a home located in Johnson County with nearby schools including Gerard Elementary School, Lowell Smith Jr. Middle School, and Cleburne High School.
Ownership History
Date
Name
Owned For
Owner Type
Purchase Details
Closed on
Nov 27, 2023
Sold by
Chasteen Melissa and Chasteen Jeffrey E
Bought by
George Suzanne Penaee
Current Estimated Value
Home Financials for this Owner
Home Financials are based on the most recent Mortgage that was taken out on this home.
Original Mortgage
$299,475
Outstanding Balance
$294,570
Interest Rate
7.57%
Mortgage Type
Construction
Estimated Equity
$21,719
Purchase Details
Closed on
Sep 11, 2018
Sold by
Beseda Aaron C and Svoboda Beseda Misty A
Bought by
Chasteen Melissa
Home Financials for this Owner
Home Financials are based on the most recent Mortgage that was taken out on this home.
Original Mortgage
$170,000
Interest Rate
4.5%
Mortgage Type
Purchase Money Mortgage
Purchase Details
Closed on
Aug 20, 2008
Sold by
Howell Elizabeth Ann
Bought by
Howell James Hulett
Create a Home Valuation Report for This Property
The Home Valuation Report is an in-depth analysis detailing your home's value as well as a comparison with similar homes in the area
Home Values in the Area
Average Home Value in this Area
Purchase History
| Date | Buyer | Sale Price | Title Company |
|---|---|---|---|
| George Suzanne Penaee | -- | Truly Title | |
| Chasteen Melissa | -- | Providence Title Co | |
| Howell James Hulett | -- | None Available |
Source: Public Records
Mortgage History
| Date | Status | Borrower | Loan Amount |
|---|---|---|---|
| Open | George Suzanne Penaee | $299,475 | |
| Previous Owner | Chasteen Melissa | $170,000 |
Source: Public Records
Tax History
| Year | Tax Paid | Tax Assessment Tax Assessment Total Assessment is a certain percentage of the fair market value that is determined by local assessors to be the total taxable value of land and additions on the property. | Land | Improvement |
|---|---|---|---|---|
| 2025 | $6,971 | $312,635 | $61,500 | $251,135 |
| 2024 | $6,971 | $312,635 | $61,500 | $251,135 |
| 2023 | $4,566 | $312,635 | $61,500 | $251,135 |
| 2022 | $6,103 | $257,959 | $49,000 | $208,959 |
| 2021 | $5,784 | $221,680 | $41,500 | $180,180 |
| 2020 | $5,669 | $204,581 | $35,000 | $169,581 |
| 2019 | $6,045 | $204,581 | $35,000 | $169,581 |
| 2017 | $4,450 | $155,131 | $35,000 | $120,131 |
Source: Public Records
Map
Nearby Homes
- 1003 Hyde Park Blvd
- 1110 Hemphill Ct
- 1500 Sharron Ct
- 1004 Canyon Ct
- 1325 Hemphill Dr
- 1233 Greenbriar Ln
- 1312 Bradley Ct
- 1304 Bradley Ct
- 1307 Bradley Ct
- 906 Chestnut Grove Dr
- 1303 Glenhaven Dr
- 1605 Heather Ct
- 1102 Tiburon Trail
- 1114 Tiburon Trail
- 1503 W Westhill Dr
- 1314 Hyde Park Blvd
- 1215 Tiburon Trail
- 912 Meadow View Dr
- 1805 Sudbury Dr
- 904 Meadow View Dr
- 1516 Hemphill Dr
- 1514 Hemphill Dr
- 1519 Cobblestone Ln
- 1602 Hemphill Dr
- 1517 Cobblestone Ln
- 1101 Hyde Park Blvd
- 1512 Hemphill Dr
- 1010 Hyde Park Blvd
- 1515 Cobblestone Ln
- 1513 Hemphill Dr
- 1102 Hyde Park Blvd
- 1604 Hemphill Dr
- 1103 Hyde Park Blvd
- 1008 Hyde Park Blvd
- 1510 Hemphill Dr
- 1513 Cobblestone Ln
- 1511 Hemphill Dr
- 1520 Cobblestone Ln
- 1518 Cobblestone Ln
- 1104 Hyde Park Blvd
Your Personal Tour Guide
Ask me questions while you tour the home.