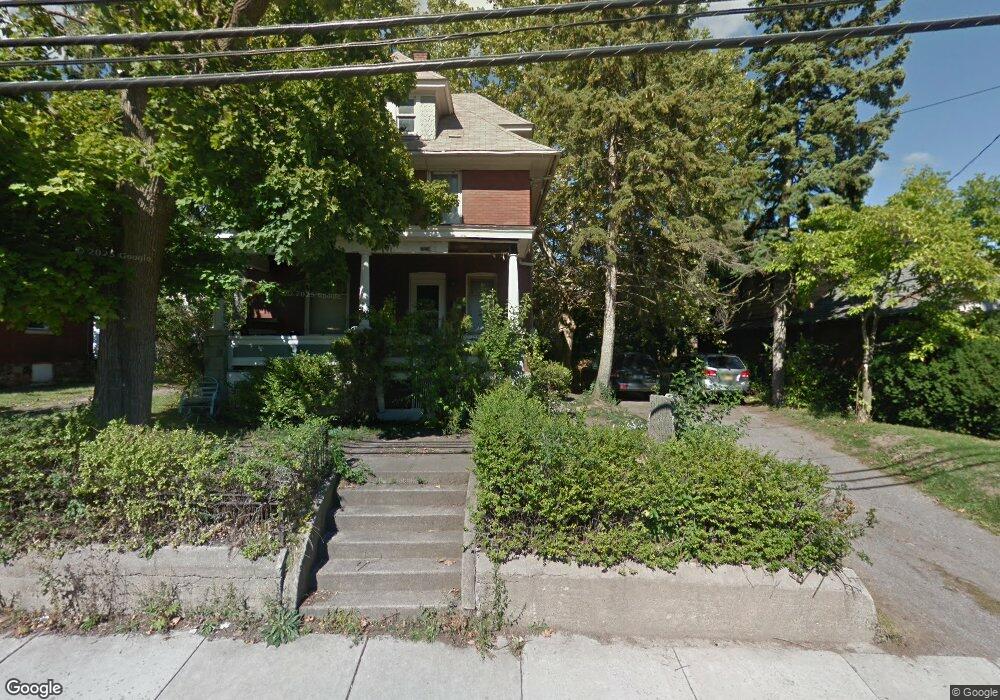
1516 Niagara St Niagara Falls, NY 14303
South End NeighborhoodEstimated Value: $84,000 - $109,000
3
Beds
1
Bath
1,575
Sq Ft
$62/Sq Ft
Est. Value
About This Home
This home is located at 1516 Niagara St, Niagara Falls, NY 14303 and is currently estimated at $97,628, approximately $61 per square foot. 1516 Niagara St is a home located in Niagara County with nearby schools including Niagara Falls High School and St. Joseph Elementary School.
Ownership History
Date
Name
Owned For
Owner Type
Purchase Details
Closed on
Apr 26, 2007
Sold by
J & F Property Resource Corp
Bought by
Bradley Richard
Current Estimated Value
Purchase Details
Closed on
Jul 20, 2006
Sold by
Homesales Inc
Bought by
J & F Property Resource Corp
Purchase Details
Closed on
Jun 7, 2006
Sold by
Szeliga Gregory A
Bought by
Homesales Inc
Purchase Details
Closed on
Sep 29, 2000
Sold by
Jarzab Estate Of Mary T.
Bought by
Szeliga Gregory A
Create a Home Valuation Report for This Property
The Home Valuation Report is an in-depth analysis detailing your home's value as well as a comparison with similar homes in the area
Home Values in the Area
Average Home Value in this Area
Purchase History
| Date | Buyer | Sale Price | Title Company |
|---|---|---|---|
| Bradley Richard | $60,000 | Christopher Mikienis | |
| J & F Property Resource Corp | $24,000 | Frank Parlato | |
| Homesales Inc | $24,650 | Bolck Colucci | |
| Szeliga Gregory A | $34,500 | J. Michael Kelleher |
Source: Public Records
Tax History Compared to Growth
Tax History
| Year | Tax Paid | Tax Assessment Tax Assessment Total Assessment is a certain percentage of the fair market value that is determined by local assessors to be the total taxable value of land and additions on the property. | Land | Improvement |
|---|---|---|---|---|
| 2024 | $1,715 | $35,000 | $2,000 | $33,000 |
| 2023 | $789 | $35,000 | $2,000 | $33,000 |
| 2022 | $630 | $35,000 | $2,000 | $33,000 |
| 2021 | $607 | $35,000 | $2,000 | $33,000 |
| 2020 | $465 | $35,000 | $2,000 | $33,000 |
| 2019 | $652 | $35,000 | $2,000 | $33,000 |
| 2018 | $534 | $35,000 | $2,000 | $33,000 |
| 2017 | $652 | $35,000 | $2,000 | $33,000 |
| 2016 | $733 | $35,000 | $2,000 | $33,000 |
| 2015 | -- | $35,000 | $2,000 | $33,000 |
| 2014 | -- | $35,000 | $2,000 | $33,000 |
Source: Public Records
Map
Nearby Homes