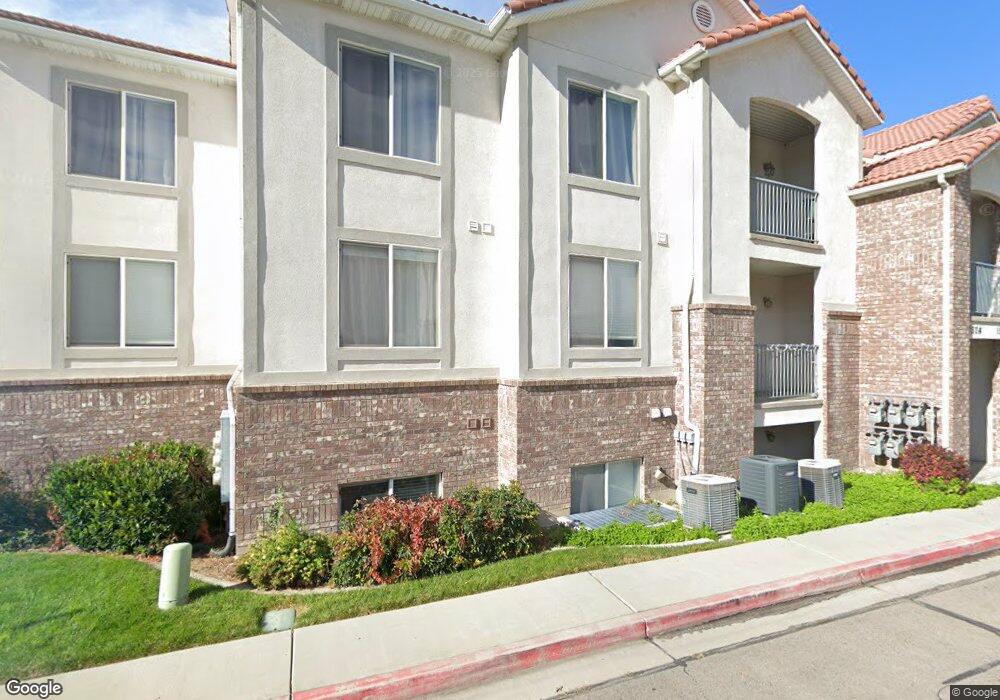
1516 S 430 W Unit 68 Orem, UT 84058
Lakeview NeighborhoodEstimated Value: $319,817 - $328,000
3
Beds
2
Baths
1,150
Sq Ft
$283/Sq Ft
Est. Value
About This Home
This home is located at 1516 S 430 W Unit 68, Orem, UT 84058 and is currently estimated at $325,272, approximately $282 per square foot. 1516 S 430 W Unit 68 is a home located in Utah County with nearby schools including Cherry Hill Elementary School, Lakeridge Jr High School, and Mountain View High School.
Ownership History
Date
Name
Owned For
Owner Type
Purchase Details
Closed on
Nov 17, 2020
Sold by
Johnson F Brent F and Johnson Paula D
Bought by
Benson Rachel and Benson Mark Alan
Current Estimated Value
Home Financials for this Owner
Home Financials are based on the most recent Mortgage that was taken out on this home.
Original Mortgage
$167,840
Outstanding Balance
$149,354
Interest Rate
2.8%
Mortgage Type
New Conventional
Estimated Equity
$175,918
Purchase Details
Closed on
May 18, 2011
Sold by
Braithwaite Daniel G and Braithwaite Stephanie
Bought by
Johnson F Brent and Johnson Paula D
Purchase Details
Closed on
May 16, 2008
Sold by
Waters W Glen and Waters Lori
Bought by
Johnson F Brent and Johnson Paula D
Home Financials for this Owner
Home Financials are based on the most recent Mortgage that was taken out on this home.
Original Mortgage
$110,000
Interest Rate
6%
Mortgage Type
Purchase Money Mortgage
Purchase Details
Closed on
May 28, 2002
Sold by
Glr Lc
Bought by
Waters W Glen and Waters Lori
Create a Home Valuation Report for This Property
The Home Valuation Report is an in-depth analysis detailing your home's value as well as a comparison with similar homes in the area
Home Values in the Area
Average Home Value in this Area
Purchase History
| Date | Buyer | Sale Price | Title Company |
|---|---|---|---|
| Benson Rachel | -- | Inwest Title Orem | |
| Johnson F Brent | -- | Provo Land Title Company | |
| Johnson F Brent | -- | Inwest Title Services Inc | |
| Waters W Glen | -- | First American Title Insuran |
Source: Public Records
Mortgage History
| Date | Status | Borrower | Loan Amount |
|---|---|---|---|
| Open | Benson Rachel | $167,840 | |
| Previous Owner | Johnson F Brent | $110,000 |
Source: Public Records
Tax History
| Year | Tax Paid | Tax Assessment Tax Assessment Total Assessment is a certain percentage of the fair market value that is determined by local assessors to be the total taxable value of land and additions on the property. | Land | Improvement |
|---|---|---|---|---|
| 2025 | $1,321 | $172,260 | -- | -- |
| 2024 | $1,321 | $161,480 | $0 | $0 |
| 2023 | $1,217 | $159,995 | $0 | $0 |
| 2022 | $1,196 | $152,295 | $0 | $0 |
| 2021 | $1,126 | $217,200 | $26,100 | $191,100 |
| 2020 | $1,023 | $193,900 | $23,300 | $170,600 |
| 2019 | $946 | $186,400 | $21,000 | $165,400 |
| 2018 | $908 | $171,000 | $21,000 | $150,000 |
| 2017 | $807 | $81,400 | $0 | $0 |
| 2016 | $781 | $72,655 | $0 | $0 |
| 2015 | $794 | $69,850 | $0 | $0 |
| 2014 | $773 | $67,705 | $0 | $0 |
Source: Public Records
Map
Nearby Homes
- 467 W 1640 S
- 302 W Hidden Hollow Dr
- 355 W 1700 S
- 1490 S 135 W
- 1675 S Lakewood Dr
- 1776 S 320 W
- 1710 S 165 W
- 458 W 1840 S
- 1700 S Sandhill Rd Unit F401
- 244 W 1060 S
- 150 W Westview Dr
- 1680 S 50 E
- 1755 S Main St
- 1758 S 50 E
- 217 W 900 S
- 1874 S Main St
- 1121 S 50 E
- 1395 S 1020 W
- 56 E 1100 S
- 1068 S Ellen Cir
- 1516 S 430 W
- 1508 S 430 W
- 1508 S 430 W Unit 67
- 1524 S 430 W
- 1524 S 430 W Unit 69
- 1526 S 430 W Unit 72
- 1518 S 430 W
- 1510 S 430 W
- 1510 S 430 W Unit 70
- 1518 S 430 W Unit 71
- 1520 S 430 W
- 1520 S 430 W Unit 63
- 1512 S 430 W
- 1504 S 430 W
- 1504 S 430 W Unit 61
- 1512 S 430 W Unit 62
- 1506 S 430 W
- 1506 S 430 W Unit 64
- 1522 S 430 W
- 1514 S 430 W
Your Personal Tour Guide
Ask me questions while you tour the home.