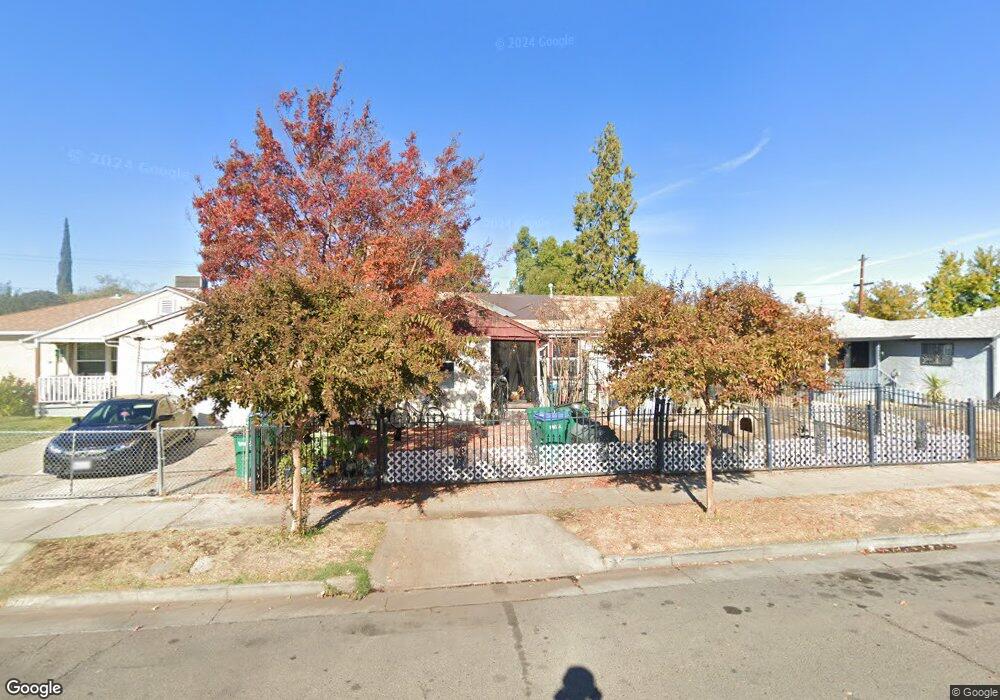
1517 E 8th St Stockton, CA 95206
Kennedy NeighborhoodEstimated Value: $218,000 - $318,000
3
Beds
2
Baths
1,174
Sq Ft
$244/Sq Ft
Est. Value
About This Home
This home is located at 1517 E 8th St, Stockton, CA 95206 and is currently estimated at $286,970, approximately $244 per square foot. 1517 E 8th St is a home located in San Joaquin County with nearby schools including Van Buren Elementary School, Alexander Hamilton Elementary, and Monroe Elementary School.
Ownership History
Date
Name
Owned For
Owner Type
Purchase Details
Closed on
Aug 6, 2013
Sold by
Leung Jessenia
Bought by
Leung Jackson
Current Estimated Value
Home Financials for this Owner
Home Financials are based on the most recent Mortgage that was taken out on this home.
Original Mortgage
$37,725
Outstanding Balance
$28,047
Interest Rate
4.46%
Mortgage Type
New Conventional
Estimated Equity
$258,923
Purchase Details
Closed on
Jul 1, 2013
Sold by
Frazier William S
Bought by
Leung Jackson
Home Financials for this Owner
Home Financials are based on the most recent Mortgage that was taken out on this home.
Original Mortgage
$37,725
Outstanding Balance
$28,047
Interest Rate
4.46%
Mortgage Type
New Conventional
Estimated Equity
$258,923
Purchase Details
Closed on
Jun 30, 2004
Sold by
Frazier Doloroes A
Bought by
Frazier William S
Create a Home Valuation Report for This Property
The Home Valuation Report is an in-depth analysis detailing your home's value as well as a comparison with similar homes in the area
Home Values in the Area
Average Home Value in this Area
Purchase History
| Date | Buyer | Sale Price | Title Company |
|---|---|---|---|
| Leung Jackson | -- | Lawyers Title Sd | |
| Leung Jackson | $50,500 | Lawyers Title Sd | |
| Frazier William S | -- | Alliance Title Co |
Source: Public Records
Mortgage History
| Date | Status | Borrower | Loan Amount |
|---|---|---|---|
| Open | Leung Jackson | $37,725 |
Source: Public Records
Tax History
| Year | Tax Paid | Tax Assessment Tax Assessment Total Assessment is a certain percentage of the fair market value that is determined by local assessors to be the total taxable value of land and additions on the property. | Land | Improvement |
|---|---|---|---|---|
| 2025 | $808 | $61,652 | $14,706 | $46,946 |
| 2024 | $795 | $60,444 | $14,418 | $46,026 |
| 2023 | $777 | $59,260 | $14,136 | $45,124 |
| 2022 | $747 | $58,099 | $13,859 | $44,240 |
| 2021 | $718 | $56,961 | $13,588 | $43,373 |
| 2020 | $731 | $56,378 | $13,449 | $42,929 |
| 2019 | $728 | $55,274 | $13,186 | $42,088 |
| 2018 | $715 | $54,191 | $12,928 | $41,263 |
| 2017 | $678 | $53,129 | $12,675 | $40,454 |
| 2016 | $689 | $52,087 | $12,426 | $39,661 |
| 2015 | $689 | $51,305 | $12,240 | $39,065 |
| 2014 | $658 | $50,300 | $12,000 | $38,300 |
Source: Public Records
Map
Nearby Homes
- 1430 E 7th St
- 2121 Scribner St
- 1105 E 7th St
- 2319 S Union St
- 719 Hyde Ct
- 822 E 4th St
- 2020 S American St
- 3011 Anne St
- 2052 E 4th St
- 421 E 8th St
- 739 E 2nd St
- 1615 S Stanislaus St
- 1954 S Sutter St
- 1827 S California St
- 3112 S B St
- 1602 S Sutter St
- 231 E 5th St
- 3338 Zamora Way
- 2150 Michael Ave
- 2258 E Loomis Rd