NOT LISTED FOR SALE

Estimated Value: $2,289,000 - $2,417,000

3 Beds
2 Baths
1,904 Sq Ft
$1,235/Sq Ft Est. Value

Last Sold December 08, 2021

Last sale price $2,100,000 $1,103 Per Sq Ft

Est. 12% increase in value since last sale

Current estimated payment $14,856/month

About This Home

As of December 2021

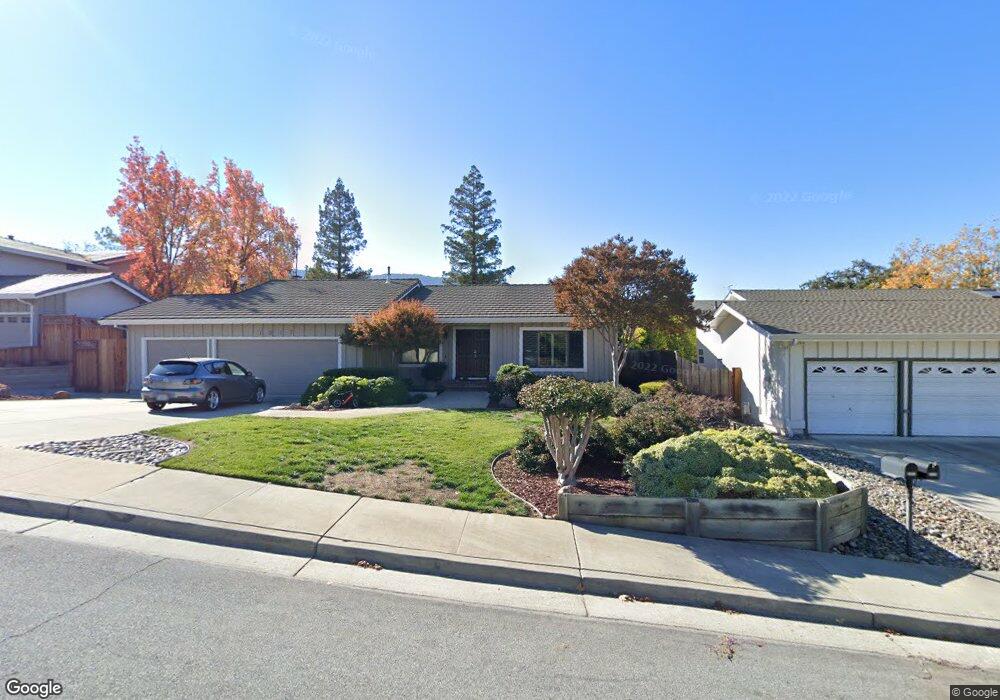
Escape the hustle & bustle of Silicon Valley with this elegant Shea-built home with 1900+ Sq. Ft. of living space, and a nearly 9300 Sq. Ft. lot. Situated on a quiet cul-de-sac, enjoy modern amenities, luxurious comfort, and a serenely landscaped backyard, in the prestigious Oak Canyon neighborhood of Almaden. Experience an open concept modern style chefs kitchen with Cambria quartz countertops, Sapele wood cabinets, smart Bosch appliances, and Puronics reverse osmosis water filtration system. High tech features include solar power, Haiku ceiling fans, sun tunnels, whole house fan, Fleck water softener, Samsung W/D, Eternal tankless water heater, and a 3-car garage with EV charging port & Danby freezer. Other amenities encompass 5/8" Red Oak hardwood floors, Milgard dual pane windows & doors, plantation shutters, fresh custom paint inside and out, top Union District schools, and proximity to trails, parks, shopping and FWYs. Buyer to verify square footage (residence & lot) and schools.

Ownership History

Date Name Owned For Owner Type

Purchase Details

Listed on
Nov 1, 2021
Closed on
Nov 9, 2021
Sold by
Torres Mauro T and Torres Karen P
Bought by
Na Sy Yang and Chou Chiawen
Seller's Agent
Shawn Ansari
Compass
Buyer's Agent
Ann McKinney
Redfin
List Price
$1,748,000
Sold Price
$2,100,000
Premium/Discount to List
$352,000
20.14%
Current Estimated Value
$2,352,247

Home Financials for this Owner

Home Financials are based on the most recent Mortgage that was taken out on this home.
Estimated Appreciation
$252,247
Avg. Annual Appreciation
2.97%
Original Mortgage
$1,680,000
Outstanding Balance
$1,542,613
Interest Rate
3.14%
Mortgage Type
New Conventional
Estimated Equity
$809,634

Purchase Details

Closed on
Apr 9, 2012
Sold by
Torres Mauro T and Torres Karen P
Bought by
Torres Mauro T and Torres Karen P

Home Financials for this Owner

Home Financials are based on the most recent Mortgage that was taken out on this home.
Original Mortgage
$134,000
Interest Rate
3.84%
Mortgage Type
New Conventional

Purchase Details

Closed on
Feb 5, 2003
Sold by
Torres Mauro T and Torres Karen P
Bought by
Torres Mauro T and Torres Karen P

Home Financials for this Owner

Home Financials are based on the most recent Mortgage that was taken out on this home.
Original Mortgage
$156,000
Interest Rate
5.89%

Purchase Details

Closed on
Jul 15, 2002
Sold by
Torres Mauro T and Torres Karen P
Bought by
Torres Mauro T and Torres Karen P

Home Financials for this Owner

Home Financials are based on the most recent Mortgage that was taken out on this home.
Original Mortgage
$155,000
Interest Rate
6.69%
Source: Public Records

Range of Values:

Collateral Analytics

Collateral Analytics Collateral Analytics AVMs (Automated Valuation Model) employ a number of statistical approaches combined with neighborhood-specific comparable selection guarantees the most up-to-date and precise valuations.

Not Available

Collateral Analytics does not have data for the current month. Please view the chart for historical values.

ICE

ICE Mortgage Technology ICE Mortgage Technology’s AVM (Automated Valuation Model) is a state-of-the-art online residential property valuation tool that provides a quick and accurate estimate of the value of almost any home in the U.S.

Not Available

ICE Mortgage Technology does not have data for the current month. Please view the chart for historical values.

First American

First American First American Data & Analytics’ next-generation AVM combines unrivaled data assets with a blended ensemble of valuation models to produce highly accurate, reliable valuations you can trust.

Not Available

First American does not have data for the current month. Please view the chart for historical values.

Quantarium

Quantarium Quantarium’s valuation service, repeatedly proven the industry’s most accurate and comprehensive, is supercharged with a self-learning and auto-tuning AI engine that continually becomes smarter and more accurate as it processes daily inputs from the industry’s leading RE data lake.

Not Available

Quantarium does not have data for the current month. Please view the chart for historical values.

Average Value
Not Available
List Price
Sold Price
Create a Home Valuation Report for This Property
The Home Valuation Report is an in-depth analysis detailing your home's value as well as a comparison with similar homes in the area

Home Values in the Area

Source: Public Records

Average Home Value in this Area


Source: Public Records

Purchase History

Date Buyer Sale Price Title Company
Na Sy Yang $2,100,000 Chicago Title Company
Torres Mauro T -- First American Title Company
Torres Mauro T -- First American Title Co
Source: Public Records

Mortgage History

Date Status Borrower Loan Amount
Open Na Sy Yang $1,680,000
Previous Owner Torres Mauro T $134,000
Previous Owner Torres Mauro T $156,000
Previous Owner Torres Mauro T $155,000
Source: Public Records

Property History

Date Event Price List to Sale Price per Sq Ft Prior Sale
12/08/2021 12/08/21 Sold $2,100,000 +20.1% $1,103 / Sq Ft View Prior Sale
11/02/2021 11/02/21 Pending -- -- --
11/01/2021 11/01/21 For Sale $1,748,000 -- $918 / Sq Ft

Tax History Compared to Growth

Source: Public Records

Tax History

Year Tax Paid Tax Assessment Tax Assessment Total Assessment is a certain percentage of the fair market value that is determined by local assessors to be the total taxable value of land and additions on the property. Land Improvement
2025 $29,062 $2,228,536 $1,782,829 $445,707
2024 $29,062 $2,184,840 $1,747,872 $436,968
2023 $28,522 $2,142,000 $1,713,600 $428,400
2022 $27,916 $2,100,000 $1,680,000 $420,000
2021 $6,600 $413,917 $132,372 $281,545
2020 $6,535 $409,674 $131,015 $278,659
2019 $6,400 $401,643 $128,447 $273,196
2018 $6,237 $393,769 $125,929 $267,840
2017 $6,150 $386,049 $123,460 $262,589
2016 $5,867 $378,481 $121,040 $257,441
2015 $5,770 $372,796 $119,222 $253,574
2014 $5,220 $365,494 $116,887 $248,607
Source: Public Records

Agents Affiliated with this Home

  • Section Image
  • Section Image
See All Agents

Map